
Summary Statement
A broad collection of tables and charts covering health and safety in the U.S. construction industry, as well as considerable economic and training data.
2007
Section 19: Employment and Unemployment in Construction and Other Industries
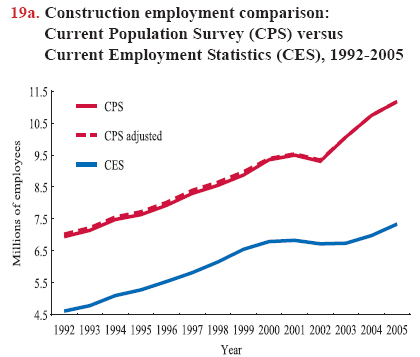
Construction employment rose by 59.3% in 1992-2005, from 7.02 million to 11.18 million (chart 19a). Even with the housing market slowdown in 2002, total employment in construction increased from 10 million in 2003 to 11 million in 2005. Consistent with these data from the Current Population Survey (CPS), the Current Employment Statistics (CES) indicates payroll employment in construction increased from 4.6 million in 1992 to 7.3 million in 2005, a 58.7% increase (chart 19a). (For an explanation of the differences between CPS and CES, see chart book page 9).
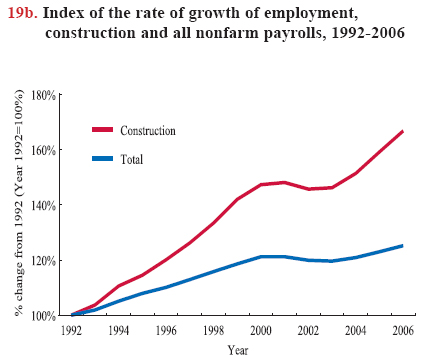
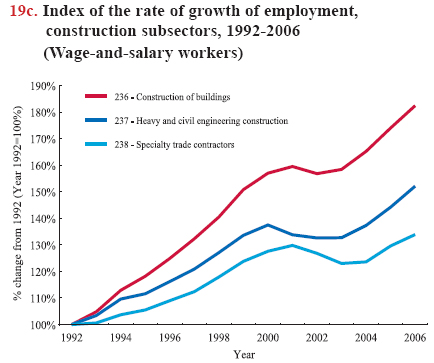
Construction employment expanded more rapidly than nonfarm payroll employment: 67% for construction and 25% for all industries respectively from 1992 to 2006 (chart 19b).Employment increases varied within construction subsectors. From 1992 to 2006, employment of Specialty Trade Contractors (NAICS 238) grew most rapidly, by 81%, from 2.7 million to 4.9 million. Employment in the Construction of Buildings (NAICS 236) increased by 50%, from 1.2 million to 1.8 million in the same period. Heavy and Civil Engineering Construction (NAICS 237) employment grew by 37%, from 0.7 million to nearly 1.0 million (chart 19c).
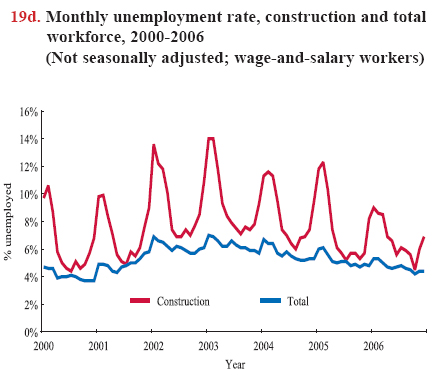
Unemployment persists in the construction industry at a rate higher than for all industries, in part because of the intermittent nature of construction work with higher unemployment in winter and lower in summer and autumn. The unemployment rate in 2006 yielded the least seasonal variation in recent years, ranging from a low of 4.5% (October) to a high of 9.0% (January) in construction, while the unemployment figures were 4.2% (October) and 5.3% (January) for all nonfarm wage-and-salary workers.1 From 2000 to 2006, the unemployment rate reached its highest point for both construction and all industries in 2003, but unemployment rates have declined continuously since then (chart 19d).
The estimate of unemployment is derived from the Current Population Survey. People counted as unemployed are those who had no employment during a given week (the reference week), were available for work (except for being temporarily ill), and had tried to find employment some time (or were waiting to be recalled from temporary layoff) during the 4-week period ending with the reference week. The Federal-State Unemployment Insurance Program is another source of unemployment data, which is combined with the Current Population Survey and the Current Employment Statistics to measure employment and unemployment statewide and nationwide.
The Current Population Survey estimates are updated to incorporate new information from censuses and new estimates of immigration. Starting with 2003, in addition to changes in industrial and occupational classification systems used in the population survey (see chart book pages 1 and 10), the U.S. Bureau of Labor Statistics replaced (statistical) sample weights based on the Census 1990 population controls with the Census 2000 population controls.2 As a result, for instance, the Hispanic population estimate increased by 8% from 1990 to 1999.3 Similarly, the payroll survey adjusts its benchmark once a year based on a sample of the tax records filed by nearly all employers with state employment security agencies. For example, over the past decade, absolute benchmark revisions have averaged 0.2%, ranging from less than 0.1% percent to 0.6%.4
Download MS PowerPoint versions of Charts
1. The average yearly unemployment rate was 6.7% for construction and 4.7% for all nonfarm workers in 2006. Self-employed and workers in public sectors are excluded in this comparison.
2. Mary Bowler, Randy E. Ilg, Stephen Miller, Ed Robison, and Anne Polivka. 2003. Revisions to the Current Population Survey Effective in January 2003. Employment & Earnings, 50(2):4-23.
3. Marisa L. Di Natale. 2003. Creating Comparability in the Current Population Survey Employment Series, http://www.bls.gov/cps/cpscomp.pdf (Accessed November 2007).
4. U.S. Bureau of Labor Statistics. CES benchmark articles, March 2006, http://www.bls.gov/web/cesbmart.htm (Accessed November 2007).
Note:
Chart 19a - Covers all construction occupations, including managers and clerical staff.
Chart 19b - Data covers only private-sector nonfarm, civilian wage-and-salary workers; no self-employed are counted. Figures are yearly averages.
Chart 19c - Data covers payroll employment in construction. Self-employed workers are excluded.
Chart 19d - Data are gathered monthly, are not seasonally adjusted, and cover unemployment only among private-sector nonfarm, civilian wage-and-salary workers, excluding self-employed workers. The tick for each year on the x-axis indicates January.
Source:
Chart 19a - U.S. Bureau of Labor Statistics, 2005 Current Population Survey (CPS). Calculations by CPWR Data Center. U.S. Bureau of Labor Statistics, 2005 Current Employment Statistics (CES).
Charts 19b and 19c - U.S. Bureau of Labor Statistics, 2006 and previous years Employment and Earnings, http://data.bls.gov/ (Accessed November 2007).
Chart 19d - U.S. Bureau of Labor Statistics, Labor Force Statistics from the Current Population Survey, http://www.bls.gov/webapps/legacy/cpsatab11.htm (Accessed November 2007).
Back to Table of Contents