
Summary Statement
A broad collection of tables and charts covering health and safety in the U.S. construction industry, as well as considerable economic and training data.
2007
Section 20: Self-Employment in Construction and Other Industries
Self-employment data are collected monthly as part of the Current Population Survey (CPS) of the U.S. Bureau of Labor Statistics (BLS; see chart book page 9). The survey classifies respondents according to industry and occupation, but also subdivides employment by class of worker, that is, wage-and-salary employment, self-employment, and unpaid family work.
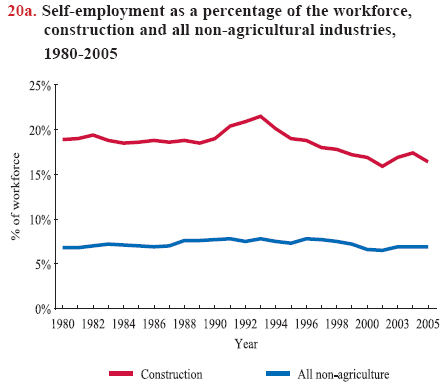
Those who respond to the survey are asked, "Last month, were you employed by the government, by a private company, a nonprofit organization, or were you self-employed?" Those who respond that they are self-employed are asked, "Is this business incorporated?" Those who respond "yes" to being incorporated are considered wage-and-salary workers in many BLS publications. The rationale for classifying the incorporated self-employed as wage-and-salary workers is that, legally, they are the employees of the businesses and thus receive wages or salaries.1 The "no" responses are classified as unincorporated self-employed – the measures that are typically used in BLS tabulations. However, this chart book counts both incorporated and unincorporated as self-employed.In recent decades, the proportion of the construction workforce who is unincorporated self-employed has remained higher than in all non-agricultural industries combined (chart 20a). While the proportion for all non-agricultural industries has remained fairly constant, the proportion of unincorporated self-employed workers in construction somewhat varied from 21.5% in 1993 to 15.9% in 2001. Unemployed workers may treat unincorporated self-employment as a low-paying alternative to wage work. During economic downturns, the likelihood of being laid off rises and the prospect of finding a job offer diminishes, making self-employment the only choice for construction workers. When the job market becomes more favorable, self-employment becomes less attractive and the number of unincorporated self-employed persons declines.2
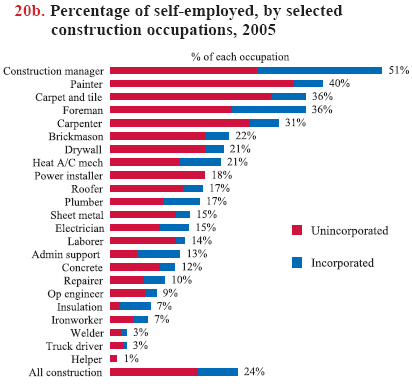
In 2005, 2.6 million workers reported themselves as self-employed in construction, of whom 1.8 million (69%) were unincorporated.3 The distribution of self-employment varies among construction occupations. Construction manager is the occupation with the largest proportion of self-employed workers in construction (51%); of those, 54% were unincorporated self-employed. The occupation with the second largest proportion of self-employed workers is painter; 87% of the self-employed painters were unincorporated (chart 20b).
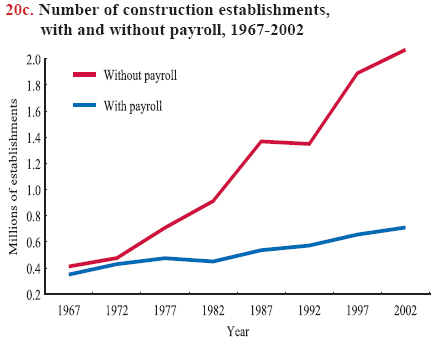
Additional data on self-employment is available in the Economic Census produced by the U.S. Census Bureau (chart 20c). The Census Bureau obtains data on establishments without payroll from the administrative records of the Internal Revenue Service and the Social Security Administration. The proportion of nonemployer establishments increased 22% since the 1970s (see chart book page 3). (The number of establishments, however, does not correspond to the number of owners.)
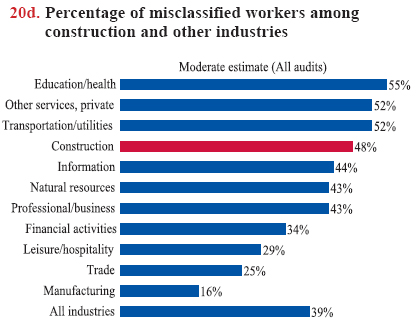
The BLS also lists the self-employed as "independent contractors" and as one type of "alternative work arrangement" with on-call workers, or employees of a temporary service company or contract (leasing) employment company (see chart book page 21). In some cases, employers are believed to misclassify employees as independent contractors to avoid paying Social Security, workers' compensation, and other taxes. For example, studies estimated that at least one in seven construction employers (14%) in Massachusetts and Maine misclassified full-time workers as independent contractors or self-employed,4 and those employers misclassified 48% of construction workers they hired (chart 20d).
Employee misclassification creates severe challenges for workers, employers, and insurers, as well as for policy enforcement. Misclassified workers lose access to unemployment compensation and to adequate levels of workers' compensation insurance. Also, misclassified workers are liable for the full Social Security tax and lose access to employment-based benefits. For employers, the practice of misclassification creates an uneven playing field among competing contractors. Employers who classify workers appropriately have higher costs and can be underbid by other employers who engage in misclassification. The collection of unemployment compensation tax, and to some degree income tax, are adversely affected by misclassification. Workers' compensation insurers also experience a loss of premiums.4
Download MS PowerPoint versions of Charts
1. Steven Hipple, Self-employment in the United States: An update. Monthly Labor Review, pp. 13-22, July 2004.
2. Ellen R. Rissman. 2003. Self-employment as an Alternative to Unemployment. Federal Reserve Bank of Chicago Working Paper 2003-34 (December), http://www.chicagofed.org/publications/workingpapers/papers/wp2003-34.pdf(Accessed November 2007).
3. U.S. Bureau of Labor Statistics, 2005 Current Population Survey. Calculations by CPWR Data Center.
4. Françoise Carré, Randall Wilson, Elaine Bernard, and Robert Herrick. 2004. The Social and Economic Costs of Employee Misclassification in the Maine Construction Industry, http://www.law.harvard.edu/programs/lwp/Maine%20Misclassification%20Maine.pdf(Accessed November 2007).
Note:
Chart 20a - The U.S. Bureau of Labor Statistics (BLS) publication used for this chart includes only unincorporated self-employed; incorporated self-employed are considered wage-and-salary workers. Agricultural or farm industries are the production or growing of food or livestock; processing is considered manufacturing.
Chart 20b - Because of the sizes of the statistical samples, estimates vary + or - 5%, except for power installer, insulation, ironworker, and sheet metal, for which the estimate may vary from the actual by + or - 8%. See listing, chart book page 10, for occupational groupings.
Source:
Charts 20a and 20b - U.S. Bureau of Labor Statistics, Current Population Survey, 2005 and previous years. Calculations by CPWR Data Center.
Chart 20c - U.S. Census Bureau, Economic Census, Industry Summary, Subject Series: Construction, 2002 and various years.
Chart 20d - Françoise Carré, Randall Wilson, Elaine Bernard, and Robert Herrick. 2004. The Social and Economic Costs of Employee Misclassification in the Maine Construction Industry, page 18, www.mccormacktmp.umb.edu/csp/publications/Maine_Misclassification.pdf(Accessed November 2007).
Back to Table of Contents