
Summary Statement
A broad collection of tables and charts covering health and safety in the U.S. construction industry, as well as considerable economic and training data.
2007
Section 9: How the Bureau of Labor Statistics Defines the Civilian Labor Force
Statistics on the civilian labor force are obtained from household (or population) and payroll (or establishment) surveys. These surveys complement each other, each providing data that the other does not. Data on characteristics of the construction workforce used in this book are mainly obtained from a household survey, the Current Population Survey (CPS), while detailed industrial classification information is derived from the Current Employment Statistics (CES), a payroll survey. Both of the surveys are conducted monthly by the U.S. Bureau of Labor Statistics (BLS).
CPS involves interviewing members of about 60,000 households randomly selected to represent the U.S. civilian noninstitutionalized population. The CPS is a rich source of demographic and employment data. It collects national totals of the number of people in the civilian labor force by sex, race, Hispanic origin, age, and unionization; the number employed, hours of work; industry and occupational groups; and information on unemployment.The civilian labor force (see Glossary) comprises all non-institutionalized civilians 16 years and over classified as employed or unemployed. The employed are those who during the reference week, (1) did any work for pay or profit or worked 15 hours or more as unpaid workers in a family enterprise and (2) had jobs but were not working because of illness, bad weather, vacation, labor-management dispute, or because they were taking time off for personal reasons, whether or not they were paid for the time off or were seeking other jobs. The unemployed did not work during the reference week, but were available for work and had looked for employment at some point in the previous four weeks. People on layoff or waiting to report to work are considered unemployed. (The civilian labor force excludes people in penal and mental facilities, homes for the aged, prisons, and on active duty in the Armed Forces.)
The CPS classifies the employed by industry, occupation, and type of employment. The employed are divided between the self-employed (see Glossary) and wage-and-salary workers, or those who receive wages, salaries, commissions, tips, or pay in kind from a private employer or a government unit. Unless otherwise noted, this chart book includes unincorporated and incorporated workers when estimating the number of self-employed. (Figures for the self-employed provided in other publications may include only the unincorporated self-employed, and thus may be smaller than the estimate.)
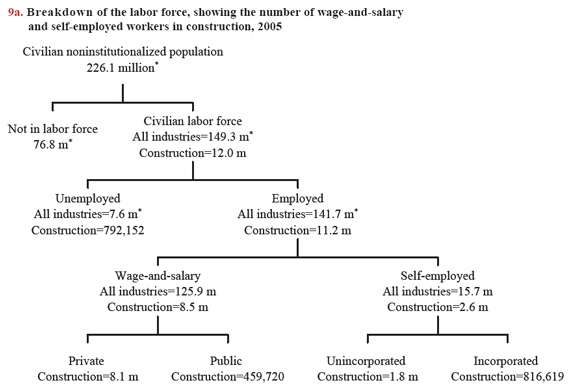
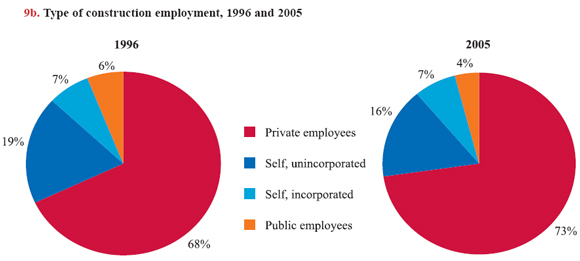
In 2005, 66% of the U.S. population were included in the civilian labor force (chart 9a). In that year, the construction workforce comprised 8% of the national workforce, while self-employed workers made up 23% of those employed in construction, fewer than in recent years (see chart book page 20). Four percent of the construction labor force was employed in the public sector in 2005, down from 6% in 1996 (chart 9b).
The CES, part of a cooperative program between the federal government and state unemployment insurance agencies, surveys about 160,000 businesses and government agencies, covering approximately 400,000 individual worksites. With a lag of about one year, BLS revises the payroll estimate to an almost complete count of U.S. payroll employment; this results in what is known as the "benchmark revision."1 As with other government data systems, CES began publishing data using NAICS 2002 (see chart book page 1) in 2003. CES plans to discontinue the present production and nonsupervisory worker hours and earnings series and instead provide all employee hours and earnings for a more comprehensive information series starting in 2007.2
Beyond the survey designs, the two employment measures also differ in concept. First, CPS is based on residence whereas CES is based on unemployment insurance filings. Second, CES counts the number of jobs, while CPS counts the number of employed individuals. Therefore, a person with multiple jobs is counted several times in CES but only once in CPS. Third, their scopes are different. While CES covers only wage-and-salary workers (see Glossary) on nonfarm payrolls, CPS covers those individuals as well as agricultural workers, the self-employed, workers in private households, unpaid family workers, and workers in unpaid leave situations; CES includes wage-and-salary workers under the age of 16, while CPS does not. Finally, while the CES sample is updated annually, the CPS sample is updated only once every 10 years.
Although the two data systems have significant differences, they indicate a similar trend in employment over time (see chart book page 19). Both CPS and CES data are published monthly in Employment and Earnings by BLS. Comprehensive historical and current data are available from the BLS website: http://www.bls.gov/cps/home.htm for CPS data, and http://www.bls.gov/ces/home.htm for CES data, respectively.
Download MS PowerPoint versions of Charts
1. Federal Reserve Bank of San Francisco, Two Measures of Employment: How Different Are They? FRBSF Economic Letter, Number 2004-23, August 27, 2004.
2. U.S. Bureau of Labor Statistics, Changes to the Current Employment Statistics Survey, http://www.bls.gov/ces/cesww.htm (Accessed November 2007).
Note:
All charts - Charts cover all construction occupations, including managers and clerical staff.
Source:
Chart 9a - U.S. Bureau of Labor Statistics, Household Data Annual Averages, 2005, www.bls.gov/cps/cpsa2005.pdf (Accessed November 2007) for figures with asterisks (*); other figures are from the 2005 Current Population Survey. Calculations by CPWR Data Center.
Chart 9b - U.S. Bureau of Labor Statistics, 2005 Current Population Survey. Calculations by CPWR Data Center.