
Summary Statement
A broad collection of tables and charts covering health and safety in the U.S. construction industry, as well as considerable economic and training data.
2007
Section 11: Union Membership and Density in Construction and Other Industries
Over 1.2 million construction workers were union members in 2005, accounting for 14.2% of the 8.5 million wage-and-salary workers in construction. Another 54,000 construction workers who were not union members were represented by unions. Of the union members, nearly 1.1 million worked for private-sector companies, and the remainder – 152,000 – were government employees.
These statistics are from the Current Population Survey, which includes two questions about union membership and coverage. First, the survey asks, "On this (main) job, are you a member of a labor union or of an employee association similar to a union?" Respondents who answer "no" are then asked, "On this job, are you covered by a union or employee-association contract?" The survey asks these questions of wage-and-salary employees only.Union membership rates are calculated using the number of respondents who answer "yes" to the union membership question, divided by the total number of respondents. "Union density" is union membership plus union coverage of workers not belonging to a union among employed wage-and-salary workers who respond to those questions.
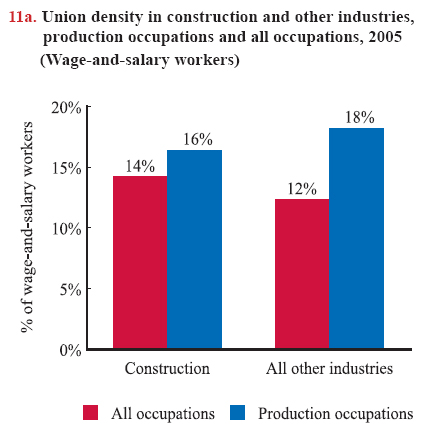
The union density rate of wage-and-salary workers (public and private sector) in construction is higher than in all industries. Also, the union density rate among construction production (blue-collar) workers is higher than density among wage-and-salary construction workers with all occupations (chart 11a).1
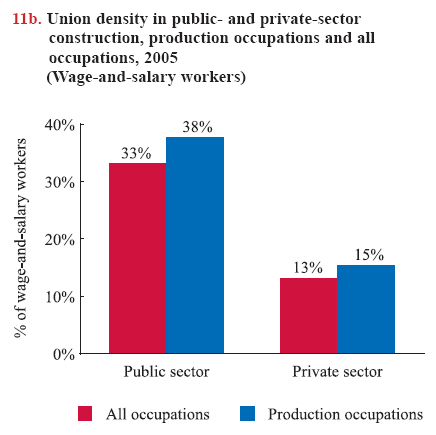
Public-sector construction has more than double the union density of private-sector construction - about 3 in 10 compared with 1 in 10, respectively (chart 11b).
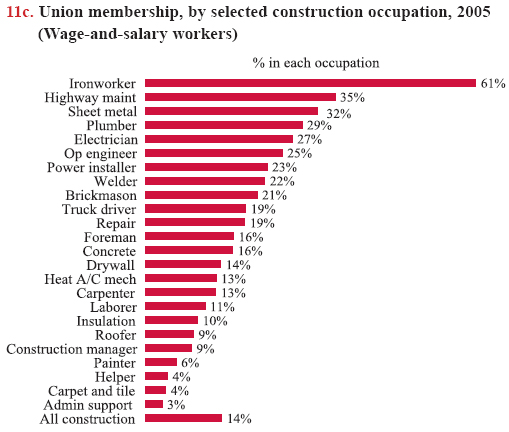
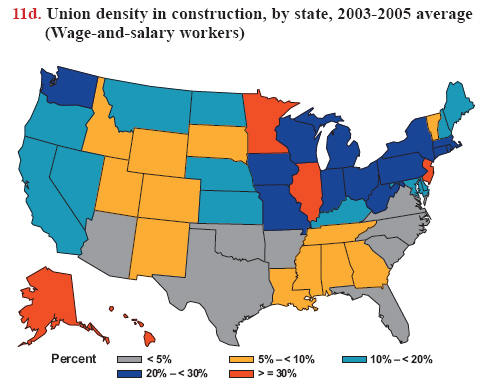
Union membership in construction varies as well among construction occupations (chart 11c) and geographic areas. Five states had an average union membership rate from 2003 to 2005 of more than 30% – with Minnesota, New Jersey, Alaska, Hawaii, and Illinois listed in increasing order (chart 11d).
Unlike this chart book, most publications refer to union density among private-sector wage-and-salary workers only. And, because the Current Population Survey interviews people who have permanent addresses and telephone numbers, it may miss some transient workers, of whom a large proportion works non-union. As a result, union density figures provided here may be slightly higher than presented elsewhere.
Download MS PowerPoint versions of Charts
1. Production workers are all workers, except managerial and administrative support staff – and include the self-employed.
Note:
Charts 11a and 11b - Production occupations, as distinguished from managerial and support staff, are coded as 6200-9750 in the Current Population Survey (see chart book page 10). Union density is union membership plus union coverage of workers not belonging to a union.
Chart 11c - These figures do not reflect total membership in any given union, which may include more than one occupation.
Source:
Charts 11a, 11b, and 11c - U.S. Bureau of Labor Statistics, 2005 Current Population Survey. Calculations by CPWR Data Center.
Chart 11d - U.S. Bureau of Labor Statistics, 2003, 2004, and 2005 Current Population Survey. Calculations by CPWR Data Center.
Back to Table of Contents