Summary Statement
A broad collection of tables and charts covering health and safety in the U.S. construction industry, as well as considerable economic and training data.
2007
Section 12: Worker Age in Construction and Other Industries
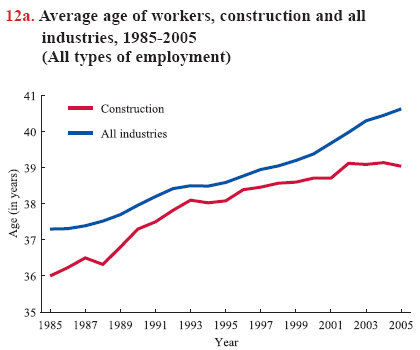
The labor force in the United States is rapidly growing older. The average age of the national labor force jumped from 37.3 to 40.6 years of age between 1985 and 2005, while median age rose from 35 to 41 years old.1(The median is the midpoint; half the workers are older and half are younger.) This aging trend is expected to influence both construction employment and the economy overall; this trend portends significant labor and skills shortages.
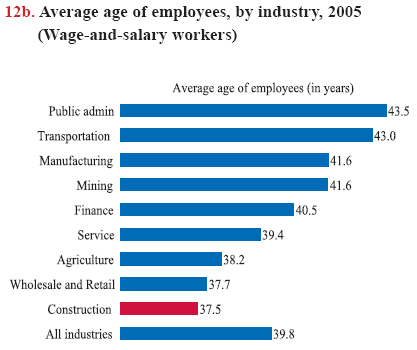
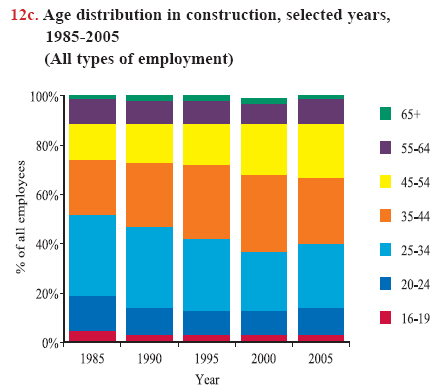
Construction workers are typically younger than the national labor force, but, they follow trends in the national labor force, pointing to an aging workforce. In 2005, the average age of construction workers was 39 years old, three years older than in 1985 (chart 12a). The average age of construction workers peaked at 39.12 years of age in 2002, and then declined slightly to 39.04 years in 2005. During this same period, the average age for the entire workforce continued to grow from 39.98 to 40.63 years old. The slight drop in the average age of construction workers occurred during a period when a significant number of young Hispanic workers joined the construction workforce (see chart book pages 13, 14, 15, and 16). As a result of this influx, construction workers now are younger than workers in any other industry on average, younger even than those in agriculture and the retail sector, which also typically employ younger workers (chart 12b).The upward shift in mean (average) and median age reflects the shifting structure of the construction labor force: fewer young workers entering the work force leads to an increasing predominance of older workers. From 1985 to 2005, the proportion of construction workers aged 45 to 54 years increased. The proportion of those aged 35 to 44 years increased from 22% to 27%, a 23% increase. At the same time, the proportion of younger construction workers, aged 16 to 19 years, decreased gradually (chart 12c). The proportion of those in the 20-to-24- year age group decreased from 14% to 11%, as did the proportion of those in the 25-to-34-year age group, from 33% to 26%, a 21% decrease for both age groups.
A major influence on the age composition of the labor force has been the baby-boom generation, those born between 1946 and 1964.2 For many years, this group has accounted for a large portion of the construction workforce and the baby boomers are now starting to retire. In 2005, about 4.4 million baby boomers (who were between 41 and 59 years of age) worked in construction, accounting for 40% of the construction workforce. By comparison, in 2000 there were 4.6 million baby boomers accounting for 49% of the construction workforce. A similar trend appeared in the labor force overall: the number of baby boomers decreased from 62.9 million in 2000 to 59.6 million in 2005, and their share of the workforce declined from 46.5% to 42.1%. But these data suggest that baby boomers in construction are retiring earlier than those in the overall labor force.
The relatively earlier exit of the baby boomers in construction from the prime-aged workforce will have a profound effect on this industry. A considerable number of workers are needed to replace jobs vacated by retirees and jobs created from industry expansion (see chart book page 30). The baby-busters, born 1965-76 who are already active in the labor market, may not be able to fully fill positions left by retired baby boomers due to their much lower birthrate than the boomers. The large number of new immigrants (such as Hispanic immigrant workers) has partially diminished the labor shortage in construction, but many of them have a lower educational level (see chart book page 28) and are employed in lower-skilled jobs (see chart book page 16). Therefore, skills shortages in particular will continue to be a challenge to the construction industry in the next decade.
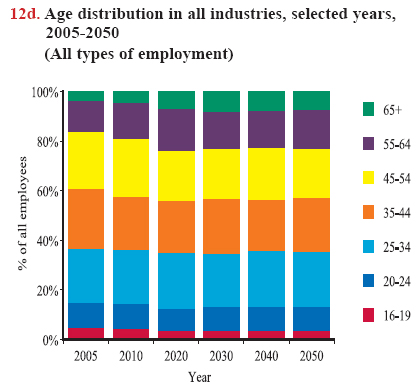
Looking to the future, the population over age 65 will climb dramatically in the coming decades. According to projections, the number of workers aged 65 and older will more than double by 2050, from 3.5% to 7.4% of the overall workforce,3 as people work longer, due in part to reform of Social Security retirement benefits.4 The growth of the older population combined with the increased participation rates among the elderly will cause the workforce to age continually until 2020 (chart 12d). This trend will bring increased attention to issues related to delaying retirement, retiree health benefits availability and affordability, longterm care, and income production in retirement.5


1. All the numbers used in the text, except for those with special notes, are from the 2005 Current Population Survey. Calculations by CPWR Data Center.
2. Mitra Toossi. Labor force projections to 2014: retiring boomers. Monthly Labor Review, November 2005, page 25-44.
3. Mitra Toossi. A new look at long-term labor force projections to 2050. Monthly Labor Review, November 2006, page 19-39.
4. U.S. Social Security Administration, Social Security Basic Facts: http://www.ssa.gov/pressoffice/IncRetAge.html (Accessed November 2007). The age for collecting full Social Security retirement benefits will gradually increase from 65 to 67 over a 22-year period beginning in 2000 for those retiring at 62. It is estimated that there are currently 3.3 workers for each Social Security beneficiary. By 2032, there will be 2.1 workers for each beneficiary.
5. Jack VanDerhei, Craig Copeland, and Dallas Salisbury. 2006. Retirement Security in the United States – Current Sources, Future Prospects, and Likely Outcomes of Current Trends. The Employee Benefit Research Institute-Education and Research Fund (EBRI-ERF).
Note:
Chart 12b - Excludes self-employed workers.
Source:
Charts 12a and 12c - U.S. Bureau of Labor Statistics, 2005 and previous years Current Population Survey. Calculations by CPWR Data Center.
Chart 12b - U.S. Bureau of Labor Statistics, 2005 Current Population Survey. Calculations by CPWR Data Center.
Chart 12d - Mitra Toossi. A new look at long-term labor force projections to 2050. Monthly Labor Review, November 2006, page 19-39.


