Summary Statement
A broad collection of tables and charts covering health and safety in the U.S. construction industry, as well as considerable economic and training data.
2007
Section 14: Foreign-born Workers in Construction and Other Industries
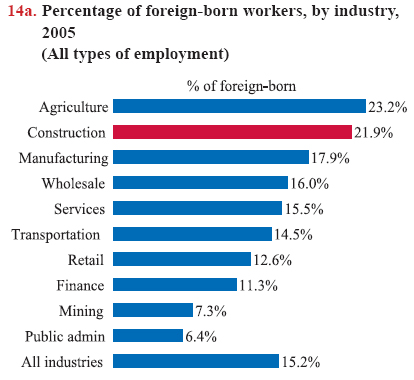
In 2005, there were 21 million foreign-born workers in the United States, making up 15% of the U.S. workforce.1 Construction employs the highest percentage of foreign-born workers outside of agriculture (chart 14a). About 2.3 million construction workers were born in foreign countries.
These statistics are from the American Community Survey, the largest household survey in the nation, with an annual sample size of about 3 million households. This survey is a part of the Decennial Census Program, a census that takes place every 10 years and next will be conducted in 2010. The survey is a new approach designed to gather accurate and timely demographic information, such as age, gender, race, and ethnicity, as well as socioeconomic indicators, including education, residence, birthplace, language spoken at home, employment, and income, on an annual basis for both large and small geographic areas within the United States.The survey defines foreign-born persons as those who reside in the United States but who were born outside the country, or one of its outlying areas, to parents who were not U.S. citizens. The foreign-born include legally-admitted immigrants, refugees, temporary residents such as students and temporary workers, and undocumented immigrants. The survey data, however, do not separately identify the number of persons in each of these categories.
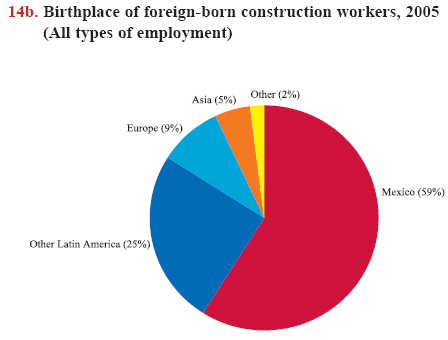
The estimate of foreign-born construction workers represents workers who were employed when the survey was conducted. In 2005, 84% of foreign-born workers in construction were born in Latin American countries (chart 14b), including 59% in Mexico, 5% in El Salvador, 4% in Guatemala, 3% in Honduras, 2% in Cuba, and a small percentage in other countries in that area. Workers born in Latin America are categorized as Hispanic origin under ethnicity. Hispanics are the fastest growing ethnic group in the United States (see chart book pages 15 and 16). Europeans made up 9% of foreign-born workers in construction, and an additional 5% came from Asia in 2005 (chart 14b). About 80% of foreign-born construction workers reported that they were not U.S. citizens when the survey was conducted.
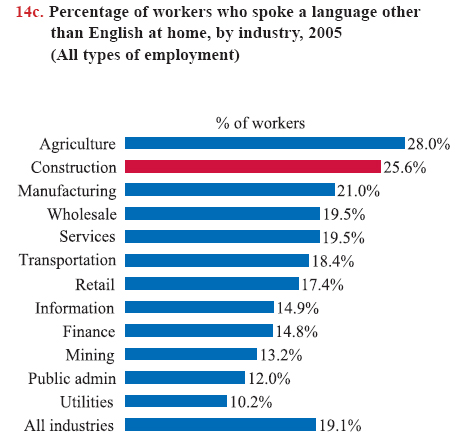
In 2005, one of four construction workers spoke a language other than English at home (chart 14c). Among foreign born construction workers, about 84% reported they spoke Spanish at home, which corresponds with the proportion of workers born in Latin America. Other languages spoken at home among foreign-born construction workers include Portuguese (2.4%), Polish (2.1%), and Russian (1.1%). Overall, more than 26 million workers in the United States spoke languages other than English at home in 2005.
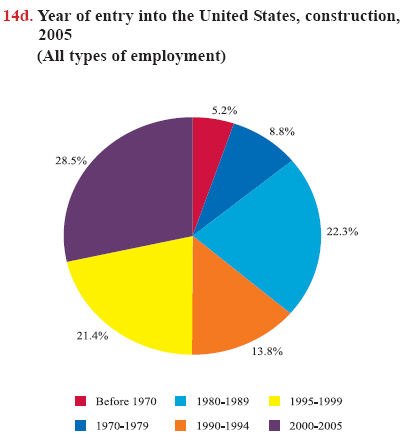
The pace of growth in the foreign-born population was much faster in the decade since 1995 than in previous years. Onehalf of all foreign-born construction workers surveyed in 2005 entered the United States since 1995 (chart 14d). Although there is no universally accepted method of estimating, it is reported that there were 7 to 11 million unauthorized immigrant workers in 2005.2,3 In addition, large numbers of immigrant workers were employed in the "informal" economy (such as some day-laborer hiring sites), and their economic activities are not recognized, regulated, or protected by law.4,5
These immigration trends are expected to continue. Almost one-third of the current population growth in the United States is caused by net immigration, or more people immigrating than emigrating. It is projected that about 86% of the population growth during the year 2050 may be due to the effects of post- 1992 net immigration.6 The large and rapid growth of immigration provides a vigorous workforce to the construction industry and presents distinct challenges as well. It has been frequently reported that immigrants have higher rates of fatalities and injuries on the job.5 There is an urgent need to develop innovative strategies to address their health and safety.


Download MS PowerPoint versions of Charts
1. U.S. Census Bureau, 2005 American Community Survey. Calculations by CPWR Data Center.
2. Jeffrey S. Passel. The Size and Characteristics of the Unauthorized Migrant Population in the U.S. Estimates based on the March 2005 Current Population Survey. Pew Hispanic Center: Research Report, March 7, 2006, http://pewhispanic.org/files/reports/61.pdf (Accessed November 2007).
3. Pew Hispanic Center. Estimates of the Unauthorized Migrant Population for States based on the March 2005 Current Population Survey. Fact Sheet April 26, 2006, http://www.pewhispanic.org (Accessed November 2007).
4. Abel Valenzuela Jr., Nik Theodore, Edwin Meléndez, and Ana Luz Gonzalez. On the Corner: Day Labor in the United States, January 2006, http://www.urbaneconomy.org/sites/default/files/onthecorner_daylaborinUS_39p_2006.pdf (Accessed November 2007).
5. AFL-CIO. Immigrant Workers at Risk: The Urgent Need for Improved Workplace Safety and Health Policies and Programs, August 2005, http://www.aflcio.org/aboutus/laborday/upload/immigrant_risk.pdf (Accessed November 2007).
6. U.S. Census Bureau. Estimates and projections of resident populations: 1950 to 2050, http://www.census.gov/prod/1/pop/profile/95/2_ps.pdf (Accessed November 2007).
Note:
Chart 14b - "Other" world areas include North America, Africa, and Oceania (islands in the Pacific Ocean and vicinity).
Source:
All charts - U.S. Census Bureau, 2005 American Community Survey. Calculations by CPWR Data Center..


