
Summary Statement
A broad collection of tables and charts covering health and safety in the U.S. construction industry, as well as considerable economic and training data.
2007
Section 22: Wages and Labor Costs in Construction and Other Industries
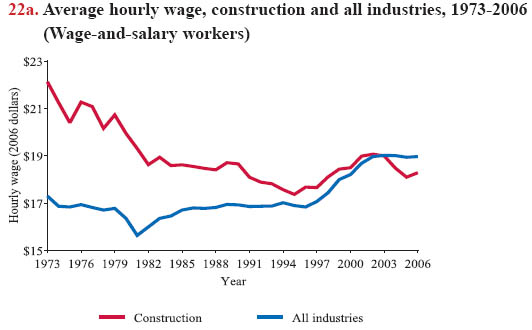
Although wage-and-salary* employment increased more rapidly in construction than in the economy as a whole during the last decade (see chart book page 19), "real" wages, or wages adjusted for inflation, have declined over time. Adjusted for inflation, construction workers in 1973 earned the equivalent of $22.13 an hour in today's dollars. However, actual average hourly pay for construction workers in 2006 was only $18.29 – 17% below their 1973 earnings adjusted for inflation (chart 22a). Construction wages have also declined relative to average hourly earnings for all workers. In 1973, construction wages were 28% higher than average hourly earnings – $22.13 in construction compared with $17.30 for all industries. In 2006, the average hourly wage in construction, $18.29, was below the average hourly wage for all industries of $18.97.
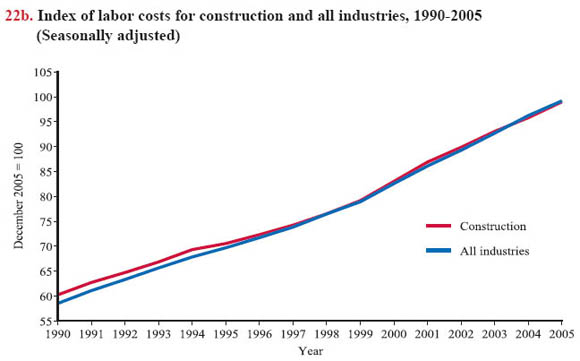
Wages are one component of total compensation, the total employer cost of employment inclusive of fringe benefits and employer-paid taxes (chart 22b). The Employment Cost Index, based on the National Compensation Survey conducted by the U.S. Bureau of Labor Statistics, provides quarterly and annual percentage changes in labor costs, which include wages, salaries, and employer costs for employee benefits. This index is one of the principal economic indicators used by the Federal Reserve Bank, the nation's central bank. The index shows trends in wages and salaries and benefit costs, as well as changes in total compensation. The survey covers private industry establishments in addition to state and local government workers; the self-employed are excluded.
The survey defines civilian workers* as all private industry and state and local government workers. Federal government, military, and agricultural workers are excluded. Wages and salaries are defined as total earnings before payroll deductions, excluding premium pay for overtime and for work on weekends and holidays, shift differentials, and nonproduction bonuses such as lump-sum payments provided instead of wage increases. Benefits are defined as paid leave, supplemental pay, insurance benefits, retirement and savings benefits, legally required benefits, and other benefits such as severance pay and supplemental unemployment insurance. When construction and all civilian workers are compared, using Employment Cost Index data, the finding, again, is that the construction worker has not gained as much (or as steadily) as workers in all industries combined. Labor costs have also declined in manufacturing and mining.
The average total compensation per hour in construction ranked fifth among industries (chart 22c). In all industries, insurance (including life, health, and disability insurance) is the most prevalent benefit available to most workers in private establishments, averaging 8.1% of the total, but such insurance accounted for 7.4% of compensation for construction wage-and-salary workers. Paid time off is another major component of benefits for workers, accounting for 23% of the total benefits on average, but only 11% for construction workers. While construction workers receive less paid leave than average, they have the highest level of mandated benefits – workers' compensation, unemployment insurance – as a percentage of the total compensation, reflecting the costs of unsafe and unstable working conditions. Benefits coverage, such as health insurance and pension, varies by union and non-union status, establishment size, occupation, and other factors (see chart book pages 26 and 27).
22c. Breakdown of average labor costs, by industry, 2006
Industry |
Total compensation |
Wages and salaries |
Benefit costs |
|||||||
Paid leave |
Supplmtl. pay |
Insurance |
Retirement and Savings |
Legally required |
Total |
|||||
$ |
% of total comp. |
$ |
% of total comp. |
|||||||
| Utilities | $48.38 | $27.95 | $4.33 | $1.91 | $4.11 | $6.74 | $3.35 | 6.9% | $20.43 | 42.2% |
| Information | $38.09 | $26.17 | $3.60 | $0.93 | $3.05 | $1.61 | $2.73 | 7.2% | $11.92 | 31.3% |
| Finance | $34.33 | $23.30 | $2.78 | $1.78 | $2.61 | $1.57 | $2.29 | 6.7% | $11.03 | 32.1% |
| Manufacturing | $29.87 | $19.44 | $2.29 | $1.22 | $2.91 | $1.46 | $2.55 | 8.6% | $10.43 | 34.9% |
| Construction | $29.41 | $20.18 | $1.06 | $1.18 | $2.18 | $1.47 | $3.35 | 11.4% | $9.22 | 31.4% |
| Transportation | $27.97 | $18.66 | $1.86 | $0.68 | $2.67 | $1.35 | $2.73 | 9.8% | $9.31 | 33.3% |
| Wholesale | $27.73 | $19.55 | $1.89 | $0.84 | $2.23 | $0.88 | $2.34 | 8.4% | $8.19 | 29.5% |
| Retail | $15.67 | $11.88 | $0.74 | $0.28 | $0.98 | $0.28 | $1.50 | 9.6% | $3.79 | 24.2% |
| All private industry | $27.31 | $19.12 | $1.91 | $0.69 | $2.22 | $1.18 | $2.19 | 8.0% | $8.18 | 30.0% |
Download MS PowerPoint versions of Charts
*See Glossary for complete definitions.
Note:
Chart 22a - Wages are in 2006 dollars.
Charts 22b and 22c - Data cover payroll (wage-and-salary) workers in the private industry.
Source:
Chart 22a - Barry T. Hirsch and David A. Macpherson, Union Membership and Earnings Data Book: Compilations from the Current Population Survey, 2007 Edition, tables 2a and 2c. Washington, D.C.: The Bureau of National Affairs, Inc., 2007.
Chart 22b - U.S. Bureau of Labor Statistics, National Compensation Survey - Compensation Cost Trends, http://www.bls.gov/ect (Accessed November 2007).
Chart 22c - U.S. Bureau of Labor Statistics, Employer Costs for Employee Compensation–September 2006, Tables 1 and 10. USDL: 06-2069, http://www.bls.gov/news.release/archives/ecec_12132006.pdf (Accessed November 2007).
Back to Table of Contents