Summary Statement
A broad collection of tables and charts covering health and safety in the U.S. construction industry, as well as considerable economic and training data.
2007
Section 25: Hours Worked, Overtime, and Time Use in Construction and Other Industries
How many hours do workers in the United States work? Data on work hours is available from three surveys: the Current Employment Statistics (CES) program, the Current Population Survey (CPS), and the American Time Use Survey (ATUS).
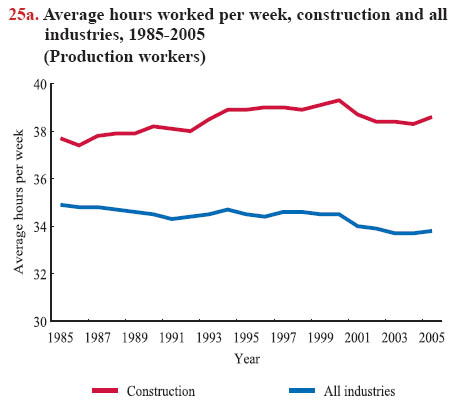
The CES data showed a long-term downward trend in average weekly hours at work for all nonfarm production employees on payroll between 1985 and 2005, but an upward trend in the working time of construction workers over this period (chart 25a). In these two decades, average weekly hours for all industries dropped from 34.9 to 33.8 hours, while time at work increased from 37.7 to 38.6 hours per week for construction.The CES data, however, have limitations. The data only covered employees and only included paid hours. A more serious limitation was that, as a survey of employers rather than employees, the data did not reflect the working hours of individuals holding more than one job. For example, if an employee worked one job for 25 hours a week and a second job 15 hours per week, the CES counted these as two short-hour jobs into its average of weekly hours, rather than recognizing there was a single employee working 40 hours per week. Instead of keeping track of all the jobs each worker has, the survey counted the average hours per week for each job.
CPS data are derived from workers' reports of their hours worked on all jobs held during the survey reference period. Also, each March, workers are asked about their hours at work in the previous calendar year, including their typical work schedule and the number of weeks they worked. CPS data suggest that, in 2005, construction workers worked, on average, 41.2 hours (median 40) per week, 48.4 weeks (median 52) or 1,984 hours (median 2,080) per year. For all industries, the comparable averages are 39.0 hours (median 40) per week, 48.6 weeks (median 52) per year, and 1,899 hours (median 2,080) per year.1 Average hours worked in construction are 5.6% higher per week, and 4.5% higher annually, than for all industries.
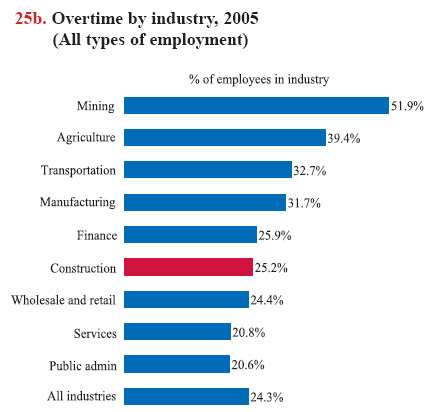
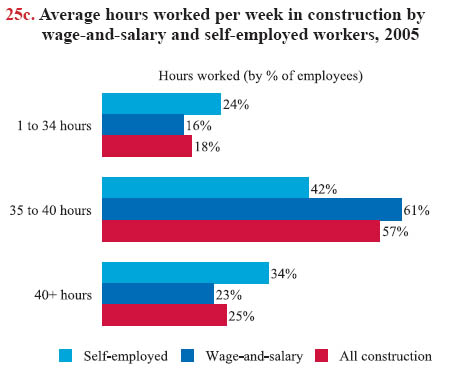
Another measure of hours worked is the proportion of people working overtime. This chart book defines overtime as beginning after 40 hours per week. More than 25% of construction workers reported working overtime in 2005, compared with 24% for all industries (chart 25b). Overtime is not distributed evenly in construction. When the type of employment is considered, self-employed workers have the longest workweek in construction (chart 25c).
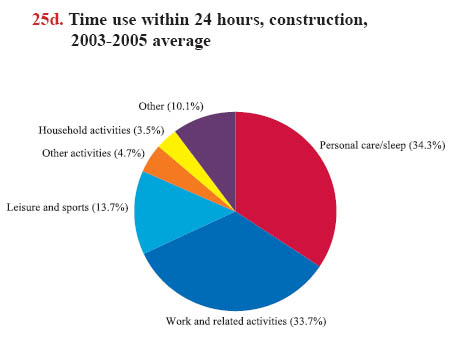
The American Time Use Survey (ATUS), a new BLS program, collects data on how people spend time over a 24-hour period. The ATUS sample is drawn from the CPS. The respondents are asked once a year to report their activities during a 24- hour "diary day." The data from ATUS showed that construction workers spent over one-third (or more than 8 hours) of a day on their jobs (chart 25d), compared with 7.6 hours spent on work for all industries. The ATUS data confirmed that construction workers are more likely to work longer hours than other workers.
The use of overtime in construction is the most common way to speed up schedule-driven projects and is used to address labor shortages. However, longer working hours may not mean higher productivity. A University of Wisconsin study found that productivity drops as the number of hours worked per week goes up and/or as project duration increases among construction trades.2
How much time people spend at work can be considered an indicator of a society's quality of life when examining the health of workers. Extended working hours and irregular work schedules are associated with increased health risks.3 Researchers have found that extended work shifts can cause serious health problems, such as cardiovascular disease, that result in disability retirement, chronic absenteeism, and high turnover rates.4 A longitudinal study on construction workers suggests that long working hours and irregular work schedules are significantly associated with a higher work-related injury rate.5 Public policy interventions, such as establishing a ceiling on work hours within a given time period as in the transportation industry, are needed to protect construction workers. Also, careful planning, staffing, training, and appropriate work schedules are essential to avoid overtime.


Download MS PowerPoint versions of Charts
1. U.S. Census Bureau, 2005 March Supplement to the Current Population Survey. Calculations by CPWR Data Center. The sample size for construction was 7,509, and for all industries was 97,034. Technical note: The standard errors were within ± 1%; ranges between upper and lower limits (95% CI) were: Construction: Hrs/wk (CI: 40.99, 41.43); Wks/yr (CI: 48.24, 48.66); Hrs/yr (CI: 1969.48, 2000.15); All industries: Hrs/wk (CI: 39.01, 39.15); Wks/yr (CI: 48.58, 48.70); Hrs/yr (CI: 1894.63, 1904.11).
2. Awad S. Hanna, Craig S. Taylor, and Kenneth T. Sullivan. 2005. Impact of Extended Overtime on Construction Labor Productivity, Journal of Construction Engineering and Management, 131(6):734-739.
3. Todd Eawson, Anneke Heiltmann, and Alex Kerin. 2004. NIOSH topic: Industry Trends, Costs and Management of Long Working hours, http://www.cdc.gov/niosh/topics/workschedules/abstracts/dawson.html (Accessed November 2007).
4. C.C. Caruso, E.M. Hitchcock, R.B. Dick, J.M. Russo, and J.M. Schmit. 2004. Overtime and extended work shifts: recent findings on illnesses, injuries, and health behaviors. U.S. Department of Health and Human Services, Centers for Disease Control and Prevention, National Institute for Occupational Safety and Health. Washington D.C.: DHHS (NIOSH); Report no. 2004-143.
5. Xiuwen Dong. 2005. Long Working Hours, Work Scheduling, and Work-Related Injuries in Construction. Scandinavian Journal of Work, Environment & Health, 31(5):329-335.
Note:
Chart 25a - Covers private sector nonfarm payrolls; excludes the self-employed.
Source:
Chart 25a - U.S. Bureau of Labor Statistics, Establishment Data, Historical Hours and Earnings, B-2. Average hours and earnings of production or nonsupervisory workers on private nonfarm payrolls by major industry, 1964 to date, ftp://146.142.4.23/pub/suppl/empsit.ceseeb2.txt (Accessed November 2007).
Charts 25b and 25c - U.S. Bureau of Labor Statistics, 2005 Current Population Survey. Calculations by CPWR Data Center.
Chart 25d - 2003-2005 American Time Use Survey. Calculations by CPWR Data Center.
Back to Table of Contents


