
Summary Statement
A broad collection of tables and charts covering health and safety in the U.S. construction industry, as well as considerable economic and training data.
2007
Section 2: Construction Establishments, Employees, and Dollar Value Produced
The Economic Census, the major source of information on the structure and performance of the U.S. economy, is conducted every five years by the U.S. Census Bureau. The 2002 Economic Census reported 2.78 million construction establishments (including establishments without payroll or nonemployer establishments, see chart book page 3) based on the 2002 NAICS, an increase of 9.2% from 2.55 million in 1997.1 Payroll establishments in construction totaled 710,307 in 2002, more than 8% higher than 656,448 in 1997.
The scope of the Construction Sector of the Economic Census (CSEC) covers construction establishments that have one or more employees. According to the Economic Census definition, an establishment (with payroll) is a single physical location at which business is conducted and/or services are provided. Therefore, a company or corporation may consist of more than one establishment (see Glossary). Because an establishment is relatively permanent, a construction project or site is not usually an establishment. The Economic Census is a survey rather than a complete census. For instance, the Economic Census included all of the medium and larger single-location establishments, but collected only a sample of smaller such establishments (the minimum sample rate was 1 in 20).Although the changes to the industrial classification systems have significantly affected the way various construction subsectors are counted, the impact on the figures for the construction industry as a whole is relatively small. The difference in the total number of construction payroll establishments is about 0.2%, as counted by the 2002 NAICS compared with the 1997 NAICS. Overall, the construction industry gained about 3% in the number of establishments under the 2002 NAICS compared with the 1987 SIC.
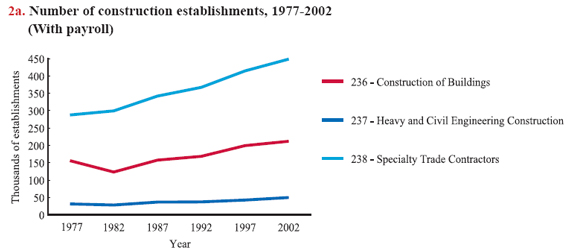
The number of establishments in the construction industry varies but generally increased over time from 1977 to 2002 (chart 2a). Specialty Trade Contractors (NAICS 238) is consistently composed of more establishments than the other two sectors (NAICS 236 and 237) combined. Disregarding the effect of changes in industrial classifications, Specialty Trade Contractors grew from 287,670 to 448,636 between 1977 and 2002, an increase of 56%, compared with a 36% increase for Construction of Buildings (NAICS 236), and a 59% increase for Heavy and Civil Engineering Construction (NAICS 237) during that period.
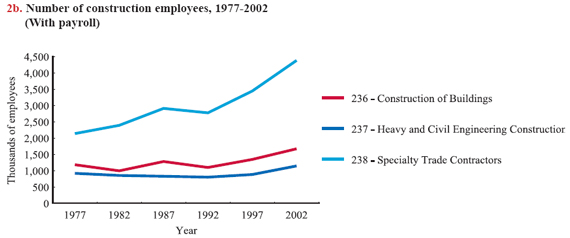
The 2002 Economic Census counted 7.2 million paid employees (see Glossary) in construction, a nearly 70% increase since 1977. About 2% of this increase is due to the revision of the coding system from SIC to NAICS. Employees on payroll in Specialty Trade Contractors more than doubled, from 2.1 million in 1977 to 4.4 million in 2002, much higher than the 41% increase for Construction of Buildings, and the 25% increase for Heavy and Civil Engineering Construction (chart 2b). The census averages counts of employees taken yearly during four sample weeks that include these dates: March 12, May 12, August 12, and November 12. In 2002, employment levels ranged from 7.1 million in March to 7.4 million in August.
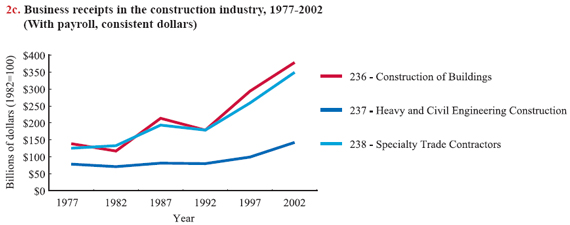
Chart 2c shows the dollar value produced by payroll construction establishments as business receipts, including the sum of the value of construction work and other business receipts (such as rental equipment and other nonconstruction activities). Nearly 99% of business receipts were from construction work. In 2002, the business receipts totaled $1,208 billion (2002 dollars), a growth of 150% since 1977 after taking inflation into account. The value produced by Construction of Buildings more than doubled from 1992 to 2002, reflecting the strong housing market in the late 1990s and early 2000s.
Download MS PowerPoint versions of Charts
1. For 2002 and 1997 Economic Census; and 2002 and 1997 Nonemployer Statistics, visit http://www.census.gov/econ/census02/ (Accessed November 2007).
Note: All charts - Data cover the private sector only.
Charts 2a and 2b - In 2002, payroll establishments totaled 710,307, with 7.2 million employees.
Chart 2c - The dollar value was adjusted by the Producer Price Index (PPI) provided by the U.S. Bureau of Labor Statistics (1982 = 100).
Source: All charts - U.S. Census Bureau, 2002 Economic Census and previous years, Industry Series, Construction. Personal contact: Tamara Cole, U.S. Census Bureau.
Back to Table of Contents