
Summary Statement
A broad collection of tables and charts covering health and safety in the U.S. construction industry, as well as considerable economic and training data.
2007
Section 30: Projected Employment, Job Creation, and Skills Shortages in Construction
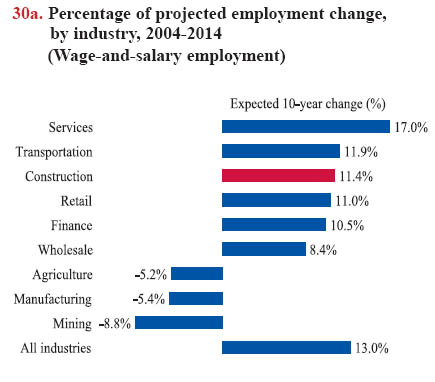
Construction employment is expected to rise in 2004-2014, although not as quickly as in the last decade. Between 1994 and 2004, wage-and-salary employment in construction grew from 5.1 million to 7.0 million, or by 37%, while such employment is projected to increase by 11% between 2004 and 2014, adding 792,000 wage-and-salary jobs.1 Although the growth rate in construction is slower than the 13% growth rate projected for the overall economy, the construction industry, which may reach 7.8 million full and part-time wage-and-salary employees, is the largest and fastest source of employment growth among goods-producing industries (see Glossary). Employment in mining is expected to decline 9%, losing 46,000 jobs over the decade (chart 30a).
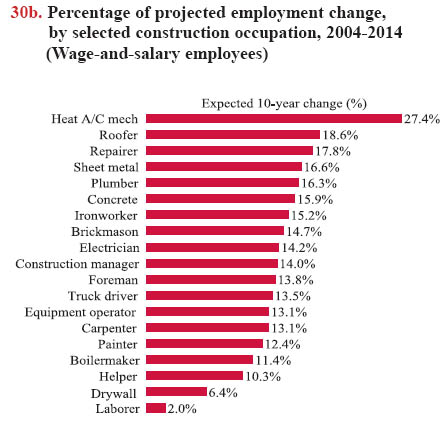
Employment growth will differ among construction occupations (chart 30b). Almost 543,000 (12%) of new wage-and-salary jobs are expected to be added to the Standard Occupational Category Construction and Extraction occupations (SOC 47-0000) in 2004-2014.2 Employment of heating, air-conditioning, and refrigeration mechanics and installer workers is projected to grow faster than any other occupation in this major group, adding more than 39,000 new jobs. Roofers, another fastgrowing occupation, are projected to add over 21,000 new jobs. The number of construction laborers is expected to increase by 14,000 by 2014.
Employment of construction managers is expected to grow as a result of advances in building materials and construction methods which would, presumably, require more oversight, as well as a proliferation of laws dealing with building construction, worker safety, and the environment. The numbers – and proportion – of office and administrative support staff are expected to decline slightly, because of increased office automation.
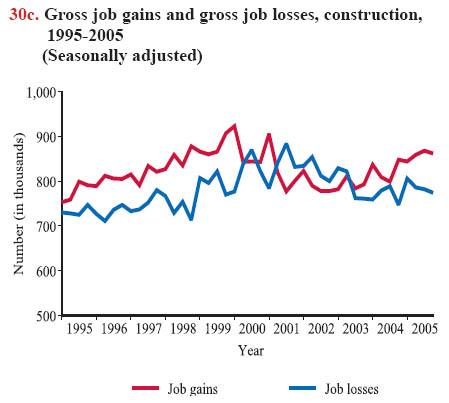
The U.S. Bureau of Labor Statistics (BLS) projects employment for a 10-year span every other year in odd-numbered years. Self-employment is estimated separately. While the BLS employment projections profile future job demands, a new BLS quarterly series – the Business Employment Dynamics (BED) – tracks changes in net growth of employment by measures of gross job gains and gross job losses (see Glossary) at the establishment level.3 The BED statistics are generated from the Quarterly Census of Employment and Wages, or ES-202 program, covering approximately 98% of all employment except for the self-employed. When gross job gains and losses are compared, the construction industry exhibited net job gains between 1995-2005, reflecting the expansion of construction employment (chart 30c).
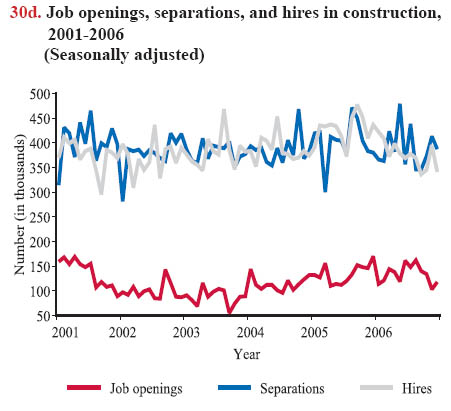
Both the projected employment data and the BED statistics measure "net" employment changes, but do not reflect the underlying dynamic flow of hires and separations that occurs within industries. Another BLS data collection tool – Job Openings and Labor Turnover Survey (JOLTS) – completes the labor market picture by collecting monthly data from a large nationwide sample of establishments to measure unmet labor demands and job turnovers.4 JOLTS data include total employment, job openings, hires, and separations, providing indicators of labor shortages at the national level. JOLTS data show that the construction industry has a high number of separations (chart 30d). Every year, about 4.5 to 4.8 million (60-70%) of wage-and-salary construction workers left their employment voluntarily or involuntarily, much higher than 41 – 46% for all industries on average. Separations include quitting (which accounts for the largest portion, more than 40%), layoffs or discharges, retirement, and disabilities. The number of hires float and overlap with the number of separations month to month, but the overall hires are slightly lower than separations – 28.0 million separations versus 27.8 million hires across the same time period. Although the unmet job demand in construction varied concurrently with the economic cycle (the lowest point of job openings was 55,000 in September 2003, and the highest point was 170,000 in December 2005), on average, more than 100,000 job openings (see Glossary) were left unfilled every month from 2001 through 2006 (chart 30d). The number of unfilled job openings is an important measure of the fluctuations of job markets and labor shortages. As the baby-boomer generation moves out of the labor force (see chart book pages 12 and 13), the construction industry will continue to face a labor shortage and, in particular, shortages of skilled craft workers.5
Download MS PowerPoint versions of Charts
1. Jay M. Berman. Industry output and employment projections to 2014. Monthly Labor Review, November 2005, pp. 45-69.
2. U.S. Bureau of Labor Statistics, 2004-14 National Employment Matrix, construction, http://www.bls.gov/emp/empiols.htm (Accessed November 2007).
3. James R. Spletzer, R. Jason Faberman, Akbar Sadeghi, David M. Talan, and Richard L. Clayton. Business employment dynamics: new data on gross job gains and losses. Monthly Labor Review, April 2004, pp. 29-42.
4. Kelly A. Clark and Rosemary Hyson. New tools for labor market analysis: JOLTS. Monthly Labor Review, December 2001, pp. 32-37.
5. ETA/Business Relations Group Report. America's Construction Industry: Identifying and Addressing Workforce Challenges, Report of Findings and Recommendations for the President's High Growth Job Training Initiative in the Construction Industry. An ETA/Business Relations Group Report, December 2004, http://www.doleta.gov/brg/pdf/High_Growth_Construction_Report_Final.pdf (Accessed November 2007)
Note:
Charts 30a and 30b - Employment projections include all occupations, but not the self-employed.
Source:
Chart 30a - U.S. Bureau of Labor Statistics, Employment by major industry sector, http://www.bls.gov/news.release/archives/ecopro_12072005.pdf (Accessed November 2007).
Chart 30b - U.S. Bureau of Labor Statistics, 2004-14 National Employment Matrix, construction, http://www.bls.gov/emp/empiols.htm (Accessed November 2007).
Chart 30c - U.S. Bureau of Labor Statistics, Business Employment Dynamics, http://www.bls.gov/data/home.htm (Accessed November 2007).
Chart 30d - U.S. Bureau of Labor Statistics, Job Openings and Labor Turnover Survey, http://www.bls.gov/data/home.htm (Accessed November 2007).
Back to Table of Contents