
Summary Statement
A broad collection of tables and charts covering health and safety in the U.S. construction industry, as well as considerable economic and training data.
2007
Section 31: Construction Death and Injury Rates in Selected Industrial Countries
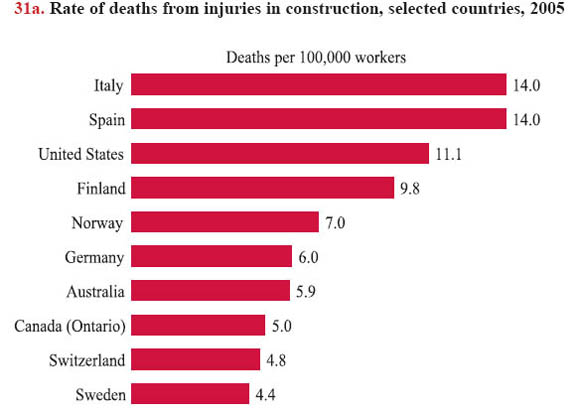
Work-related death rates for construction in 2005 ranged from 4.4 deaths per 100,000 workers in Sweden to 14.0 per 100,000 workers in Italy and Spain, among selected industrial countries (chart 31a). By comparison, the construction death rate in the United States was relatively high, 11.1 per 100,000 workers, lower only than the rates for Italy and Spain and 2.5 times higher than Sweden, which typically has lower rates than the other industrialized nations. When comparing the current construction death rates with 1992 data, the United States, Germany, Sweden, Canada, and Australia all have reduced rates.1 The United States experienced a significant reduction in its construction death rate since 1992, when it was 18.6 per 100,000 workers, or 3.1 times greater than Sweden's 1992 rate of 6.0 per 100,000 workers.
Much of the data reported here are from the International Labour Organization (ILO),2 which compiles statistics on occupational deaths and injuries based on information supplied by relevant national organizations. The ILO also compiles basic information on the sources and survey methods used in each country (chart 31b). Because of wide variability in data collection and reporting, it is difficult to compare occupational deaths and injuries across countries beyond noting these general trends.Countries also have different coverage periods for qualifying deaths as work-related (chart 31b). For example, Germany3 and Spain count fatalities as work-related for deaths that occur within one month of the accident. Australia, Finland, and Switzerland define a work-related death as one that occurs within one year of the accident, whereas Italy, Norway, Sweden, and the United States have no such limitation.
Another variable among injury and death rates is how the selected countries classify injuries from commuting accidents. Norway and the United States do not count workers' injuries from road traffic accidents as work-related if they are commuting, whereas such injuries are counted as work-related by several other countries. Italy does not technically include commuting, but provides compensation in most of the commuting accident cases; therefore such accidents are actually included in the data.
In addition to injury cases, it is essential to have numbers employed and hours worked to calculate injury rates that can be compared directly. However, obtaining the correct data from each of these countries for the calculations can be difficult. For example, the U.S. employment data are from household surveys (such as the Current Population Survey) and may not match the fatality data, which are collected from employers and other sources. Although all the selected countries reported hours worked per week for construction workers, very few countries reported weeks worked per year or hours worked per year, making it difficult to calculate comparable injury rates. Also, some countries, such as Norway, Finland, and Sweden, have a relatively small construction workforce (chart 31b) in which a small change in the number of fatalities can greatly affect that year's death rate.
Inconsistent methods of classifying industries are yet another source of data variability. The ILO asks the reporting agencies in each country to align their data with the International Standard Industrial Classification (ISIC), but many countries have their own industry classification systems. As a result, most countries' classification systems are similar enough to the ISIC to allow general comparisons at a broad level. The system may not be comparable to occupational injury and death rates within construction subdivisions across countries.
An analysis of nonfatal injury data has not been included because of wide variability in reporting and qualifying cases among countries.
In order to improve international injury data comparability, further research is needed to standardize definitions and measurement methods. Standardized occupational injury surveillance data would allow all countries, including those with very limited resources, to compute calculations according to a standard definition. Such efforts, in turn, could lead to a better understanding of the causes of occupational injuries worldwide and to develop better intervention strategies.
31b. Parameters and qualifications of construction fatalities, selected countries, 2005
| Country | # of deaths | Period for Qualifying Death as Work-Related | Includes Commuting | Includes Self-Employed | Report Source | Total Employment (In thousands) | Hours worked (per week) |
| Australia | 36 | Within one year of accident | • | • | Labor force | 887 | 38.2 |
| FInland | 12 | Within one year of accident | • | Insurance Records | 171 | 38.6 | |
| Germany | 138 | Within one month of accident | • | • | Insurance Records | 2,400 | 39.0 |
| Italy | 239 | No maximum period | • | • | Insurance Records | 2,046 | 37.0 |
| Norway | 11 | No maximum period | • | Labor inspectorate records | NA | 38.1 | |
| Spain | 248 | Within one month of accident | • | Insurance Records | 2,509 | 38.0 | |
| Sweden | 11 | No maximum period | • | • | Insurance Records | 253 | 39.3 |
| Switzerland | 13 | Within one year of accident | • | Insurance Records | 269 | 41.0 | |
| United States | 1,243 | No maximum period | • | Labor-related establishment census | 11,178 | 38.6 |
Download MS PowerPoint version of Chart 31a
Download PDF version of Chart 31b
1. The Center to Protect Workers' Rights. February 1997. The Construction Chart Book: The U.S. Construction Industry and Its Workers, First Edition, Chart 28a. The death rates (per 100,000 workers) in 1992 for the five countries were: U.S. 18.6, Germany 14.0, Australia 11.0, Canada 7.4, and Sweden 6.0.
2. International Labour Organization (ILO), http://laborsta.ilo.org (Accessed November 2007).
3. Rudolf Rostek, Referat "Statistik - Arbeitsunfälle, Prävention." Personal communication, September 2007.
Source:
All charts - International Labour Organization, http://www.ilo.org/global/lang--en/index.htm (Accessed November 2007). Australian data from the Australian Safety and Compensation Council, http://www.ascc.gov.au/ascc/AboutUs/Publications/StatReports/ (Accessed November 2007). Canadian data (for chart 31a only) from the Construction Safety Association of Ontario, Annual Report 2006, http://www.csao.org/UploadFiles/AnnualReport/Annual_Report_2006.pdf (Accessed November 2007). German data from the Head association for statutory accident insurance: Hauptverband der gewerblichen Berufsgenossenschaften, http://www.hvbg.de/d/pages/service/download/g_r/g_tabellen.pdf (Accessed November 2007).
Back to Table of Contents