
Summary Statement
A broad collection of tables and charts covering health and safety in the U.S. construction industry, as well as considerable economic and training data.
2007
Section 32: Deaths and Nonfatal Occupational Injuries and Illnesses in Construction and Other Industries
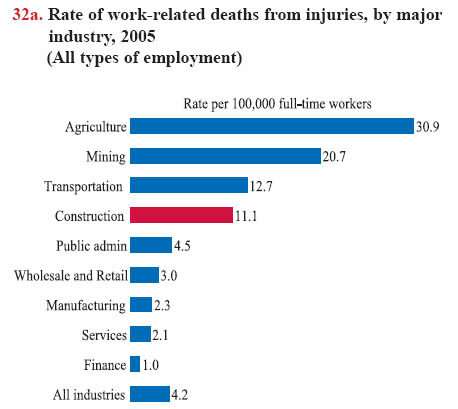
In 2005, the construction industry shared 1,243 (21.7%) of the total 5,734 work-related deaths from injuries in the United States, which is disproportionately high given that construction employment counted for 8% of the overall workforce. When comparisons were made among major industries, construction had the fourth highest death rate in 2005 (chart 32a). The death rate for construction was 11.1 per 100,000 full-time workers,1 nearly three times the average rate of 4.2 per 100,000 full-time workers for all industries.
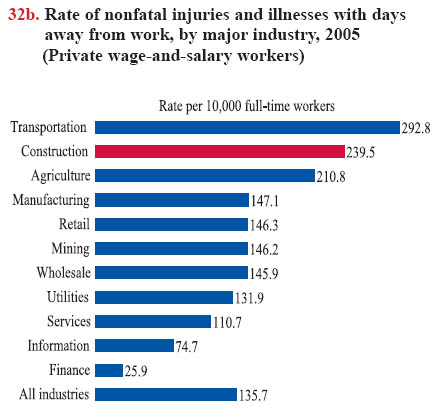
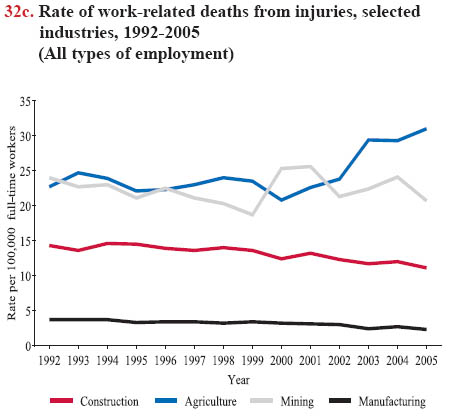
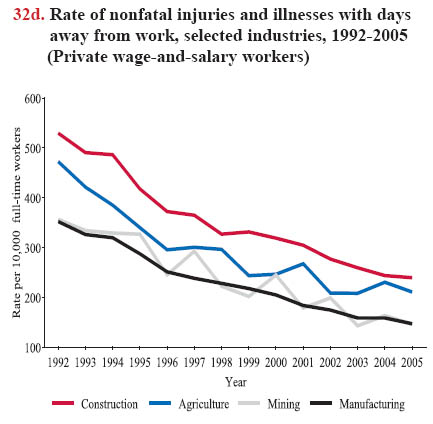
Construction workers experienced 414,900 injury and illness cases in 2005, of which 157,100 cases were serious enough to require days away from work – lost workday cases – about 628 per workday. (Illnesses are less than 2.5% of the total in construction, so the numbers for construction essentially show injuries).2 Compared with other industries, the construction industry had the second highest rate of 239.5 per 10,000 full-time workers in 2005, about 76% higher than the average rate of 135.7 per 10,000 full-time workers for all private industries (chart 32b).Overall, the rate of work-related deaths in construction declined gradually from 14.3 to 11.1 per 100,000 full-time workers from 1992 to 2005 (chart 32c), while the rate of serious nonfatal injuries and illnesses dropped significantly by 55% from 529.5 to 239.5 per 10,000 full-time workers during this period (chart 32d). The rates of work-related deaths in construction are not as high as in agriculture and mining, but the rates of nonfatal injuries and illnesses in construction exceeded that for other goods-producing industries over time. These estimates have not taken into account the impact of changes in the data sources used for the calculations.
The numbers of deaths were obtained from the Census of Fatal Occupational Injuries (CFOI) conducted by the U.S. Bureau of Labor Statistics (BLS). CFOI is a federal-state cooperative program that has been implemented in all 50 states and the District of Columbia since 1992. Data on deaths resulting from injuries are compiled from several sources, such as death certificates, workers' compensation reports, OSHA reports, and medical examiner reports. The calculations of death rates include the public and private construction sectors and self-employed workers. Thus, the numbers presented here may differ from those in BLS and other publications that include only deaths in the private construction sector. The numbers of full-time workers used for death rate calculations were from the Current Population Survey (see chart book page 9).
The nonfatal injury and illness data were from the Survey of Occupational Injuries and Illnesses (SOII), a federal state program, colleting information annually on workplace injuries and illnesses based on logs kept by private industry employers during the year. The SOII excludes the self-employed, farms with fewer than 11 employees, private households, federal government agencies, and for national estimates, employees in state and local government agencies.
Both CFOI and SOII have undergone several important changes, including the switch from the 1987 Standard Industrial Classification (SIC) system to the 2002 North American Industry Classification System (NAICS) starting with 2003 data, and major changes of recordkeeping standards in 1995 and 2001 for the SOII data collection. It is estimated that about 83% of the decline in nonfatal occupational injuries and illnesses correspond directly with changes in OSHA recordkeeping rules.3 Underreporting could be another important factor underlying the declining trends in nonfatal injuries and illnesses.4,5 Although the changes in coding systems for the data sources have significantly affected the compatibility of injury and illness data for construction subsectors over time, the impact on the construction industry as a whole is relatively small.6
Download MS PowerPoint versions of Charts
1. Since nonfatal injuries are more prevalent than deaths, this chart book uses two different units to measure rates. Fatal injuries are depicted as “per 100,00 full-time workers” and nonfatal injuries are presented as “per 10,000 full-time workers.” This standard is adopted from the U.S. Bureau of Labor Statistics (BLS) to provide larger and more detailed numbers for comparisons.
2. U.S. Bureau of Labor Statistics, Number and rate of nonfatal occupational injuries and illnesses by selected industry, http://data.bls.gov/GQT/servlet/RequestData (Accessed November 2007).
3. Employment figures in the construction sector gain about 3% due to the changes in the industrial coding system (see chart book page 3).
4. Lee S. Friedman and Linda S. Forst. The impact of OSHA recordkeeping regulation changes on occupational injury and illness trends in the U.S.: a time-series analysis. Occupational and Environmental Medicine Online, February 5, 2007, http://oem.Bmj.com/cgi/content/abstract/oem.2006.029322v1 (Accessed November 2007).
5. J. Paul Leigh, James P. Marcin, and Ted R. Miller. 2004. An estimate of the U.S. government's undercount of nonfatal occupational injuries. Journal of Occupational and Environmental Medicine, 46(1):10-18.
6. Kenneth D. Rosenman, Alice Kalush, Mary Jo Reilly, Joseph C. Gardiner, Mathew Reeves, and Zhewui Luo. 2006. How much work-related injury and illness is missed by the current national surveillance system? Journal of Occupational and Environmental Medicine, 48(4):357-365.
Note:
All charts - Because many construction workers work part-time in construction, safety and health statistics are defined in terms of full-time workers to allow comparisons with other industries. Full-time work is defined as 2,000 hours worked per year.
Charts 32a and 32c - A total of 1,243 deaths in construction and 5,734 deaths in all industries in 2005.
Source:
Charts 32a and 32c - U.S. Bureau of Labor Statistics, 1992-2005 Census of Fatal Occupational Injuries, 1992-2005 Current Population Survey. Calculations by CPWR Data Center.
Chart 32b - U.S. Bureau of Labor Statistics, 1992-2005 Survey of Occupational Injuries and Illnesses, http://www.bls.gov/iif/home.htm (Accessed November 2007). Calculations by Brooks Pierce, U.S. Bureau of Labor Statistics.
Chart 32d - U.S. Bureau of Labor Statistics, 1992-2005 Survey of Occupational Injuries and Illnesses, http://www.bls.gov/iif/home.htm (Accessed November 2007).
Back to Table of Contents