Summary Statement
A broad collection of tables and charts covering health and safety in the U.S. construction industry, as well as considerable economic and training data.
2007
Section 33: Deaths and Nonfatal Injuries in Construction, by Type of Employment and Size of Establishment
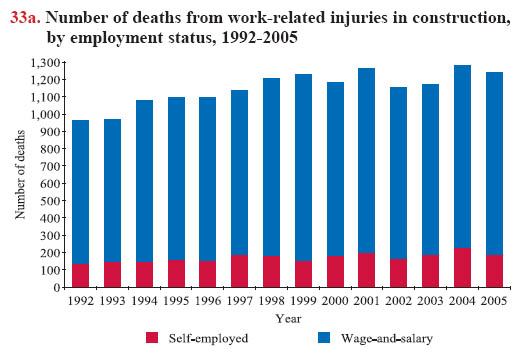
From 1992 to 2005, a total of 16,068 construction workers died from work-related injuries, an annual average of about 1,147 deaths. The increased number of deaths in recent years was due mainly to the expansion of construction employment. The death rate, in fact, declined gradually over this period (see chart book page 32). Of the total number of construction workers who died, 2,434 (13.2%) were self-employed1 (chart 33a).
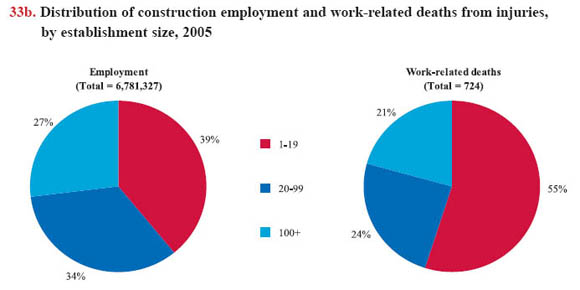
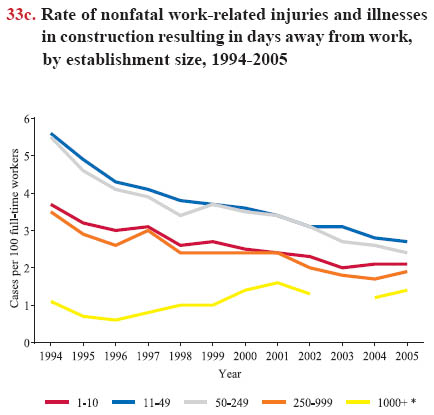
Small establishments, which form the largest segment of the construction industry (see chart book page 3), appear to suffer a disproportionate share of work-related deaths. From 1992 to 2005, 4,488 construction deaths – 44% of the total wage-and-salary workers – occurred in establishments with 10 or fewer employees.2 In 2005 alone, 55% of construction deaths occurred in construction establishments with fewer than 20 employees, a figure that is disproportionately high given that such establishments employed just 39% of the wage-and-salary workforce in construction (chart 33b). The number of employees by establishment size was obtained from the County Business Patterns (CBP), an annual survey conducted by the U.S. Census Bureau.3 Since CBP does not indicate hours worked, the distribution of deaths by establishment size was compared to the fraction of construction employment in similar-size establishments, instead of using death rates as is done for other pages in this chart book.By contrast with patterns of construction worker deaths, nonfatal injury rates for small establishments (1-10 employees) were consistently lower than for medium-size establishments chart 33c). In fact, reported rates for small establishments have been declining continuously since 1994 – when the BLS first reported injury rates by establishment size – from 3.7 to 2.1 per 100 full-time equivalent workers in 2005. Contrary to the overall trends, injury rates for the largest establishments (1,000 or more employees) increased from 1.1 per 100 full-time equivalent workers in 1994 to 1.4 in 2005, although they remained the lowest of all construction establishments. (Illnesses are less than 2.5% of the total in construction, so the numbers for construction essentially show injuries.)
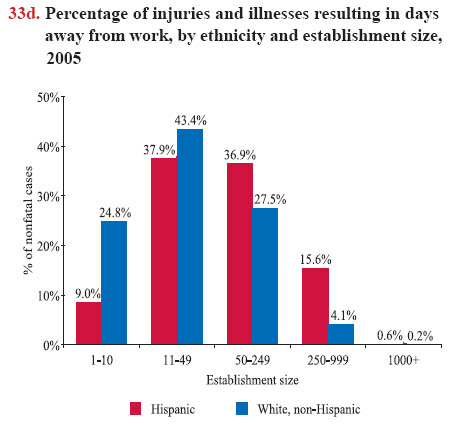
The contradictory patterns for deaths and nonfatal injuries suggest that nonfatal injuries are underreported, particularly by small establishments. Underreporting is suspected particularly when comparing injury data for Hispanic workers with white, non-Hispanic workers by establishment size. Most nonfatal work-related injuries and illnesses among Hispanic workers were reported by medium and large construction establishments; only 9% of such injuries were reported by establishments with 10 or fewer employees (chart 33d), yet it is estimated that about 32% of Hispanic workers were employed in such small establishments. 4 Additionally, the self-employed are a large part of the construction workforce (see chart book page 20), but the U.S. Bureau of Labor Statistics (BLS) does not collect nonfatal injury data for this group. Due to this exclusion, nonfatal work-related injuries and illnesses among self-employed workers are unknown.


Download MS PowerPoint versions of Charts
1. Includes owners of unincorporated and incorporated businesses or members of partnerships, and paid or unpaid family workers.
2. Deaths not reported by types of employment and establishment size were excluded.
3. The County Business Patterns (CBP) provides information for establishments with payrolls only. Thus, deaths among the self-employed were excluded from the Census of Fatal Occupational Injuries data to match numbers of employment from CBP for this analysis.
4. 2006 March Supplement to the Current Population Survey. Calculations by CPWR Data Center.
Note:
Chart 33a - "Self-employed" includes those who are designated as self-employed and those who work in a family business. "Wage-and-salary" includes those who work for pay or compensation, volunteers, and types of employment not reported.
Chart 33b - A total of 1,243 deaths in construction in 2005. Deaths not reported by establishment size and deaths among self-employed workers were excluded. Wage-and-salary employment in construction totaled 6,781,327 based on the County Business Patterns (CBP) conducted by the U.S. Census Bureau.
Chart 33c - Rates are in terms of full-time work defined as 2,000 hours worked per year. *Data are not available for establishments with 1000+ employees in 2003.
Source:
Chart 33a - U.S. Bureau of Labor Statistics, 1992-2005 Census of Fatal Occupational Injuries. Calculations by CPWR Data Center.
Chart 33b - U.S. Bureau of Labor Statistics, 2005 Census of Fatal Occupational Injuries; U.S. Census Bureau, 2005 County Business Patterns, http://www.census.gov/epcd/cbp/view/cbpview.html (Accessed November 2007). Calculations by CPWR Data Center.
Chart 33c - U.S. Bureau of Labor Statistics, 1994-2005 Survey of Occupational Injuries and Illnesses, http://www.bls.gov/iif/home.htm (Accessed November 2007).
Chart 33d - U.S. Bureau of Labor Statistics, 2005 Survey of Occupational Injuries and Illnesses, http://www.bls.gov/iif/home.htm (Accessed November 2007). Calculations by CPWR Data Center.
Back to Table of Contents


