Summary Statement
A broad collection of tables and charts covering health and safety in the U.S. construction industry, as well as considerable economic and training data.
2007
Section 35: Deaths and Injuries within Construction Occupations
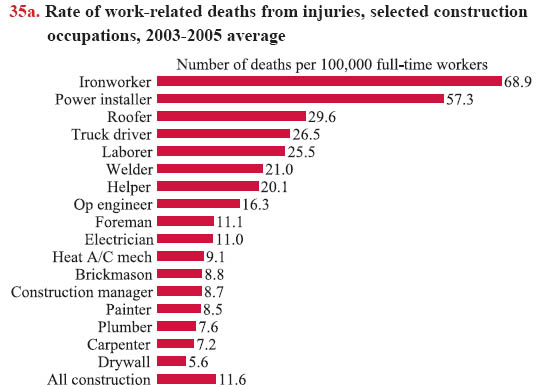
Injury numbers and rates vary widely among construction occupations. For the period 2003-2005,1 ironworkers (structural iron and steel workers in the U.S. Bureau of Labor Statistics' occupational code) and electrical power installers had the highest rates of work-related deaths at, respectively, 68.9 and 57.3 per 100,000 full-time workers (chart 35a). The death rate for ironworkers during that same three-year period was almost six times higher than the rate of 11.6 per 100,000 full-time workers for all construction occupations combined. Still, fatal injury rates have declined for these two high-risk occupations since 1992, when ironworkers experienced 143.3 deaths per 100,000 full-time workers and power installers had 149.3 deaths per 100,000 fulltime workers.
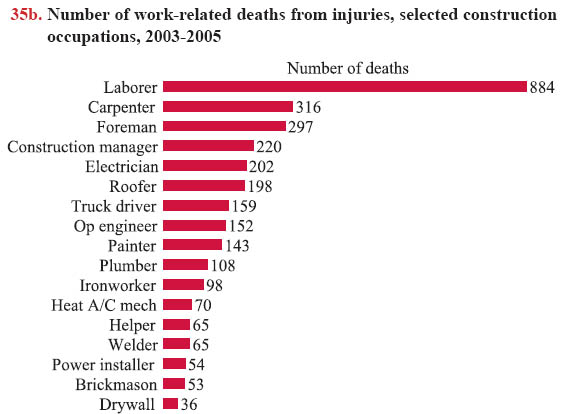
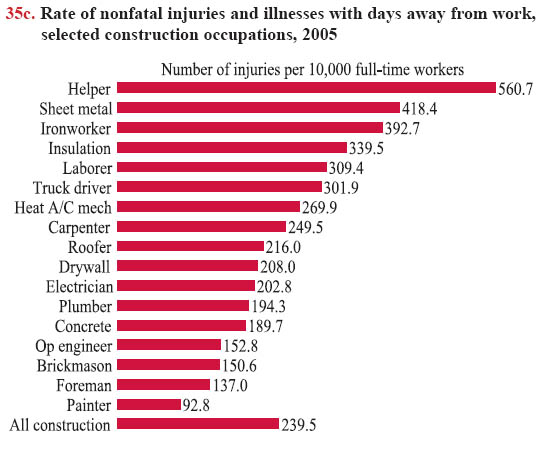
Although the rate of work-related deaths among construction laborers was less than half as high as the rate for ironworkers, the number of laborers killed on the job was higher than any other construction occupation – 884 compared with 98 ironworker deaths (chart 35b).The trends for nonfatal work-related injuries and fatal injuries are different. Construction helpers had the highest rate of nonfatal injuries, at 560.7 per 10,000 full-time workers (chart 35c). Also, sheet metal workers, ironworkers, insulation workers, construction laborers, and truck drivers experienced much higher (at least 50% higher) rates of nonfatal injuries than the injury rate average for all construction occupations combined.
In charts 35a and 35b, the numbers of deaths were obtained from the Census of Fatal Occupational Injuries (CFOI) conducted by the U.S. Bureau of Labor Statistics (BLS, see chart book page 32). The number of construction workers, expressed as full-time workers, was obtained from the Current Population Survey (see chart book page 9). The nonfatal injury and illness data in chart 35c are from the Survey of Occupational Injuries and Illnesses (SOII), another BLS survey (see chart book page 32). Starting with 2003 data, BLS replaced the 1980 Standard Occupational Classification (SOC) system with the 2000 Standard Occupational Classification (SOC) system in the CFOI and SOII data collections. BLS also started to use the 2002 Census Occupational Classification system in the Current Population Survey beginning in 2003 (see chart book page 10). Due to coding system modifications and other changes in these three data sources, numbers reported on this page may not be directly comparable to those in previous publications.


Download MS PowerPoint versions of Charts
1. Since some occupations have a relatively small number of employees, three-year averages are used because they provide more reliable estimates than data from a single year.
Source:
Charts 35a and 35b - U.S. Bureau of Labor Statistics, 2003-2005 Census of Fatal Occupational Injuries and 2003-2005 Current Population Survey. Calculations by CPWR Data Center.
Chart 35c - U.S. Bureau of Labor Statistics, 2005 Survey of Occupational Injuries and Illnesses, 2005 Current Population Survey. Calculations by CPWR Data Center.
Back to Table of Contents


