
Summary Statement
A broad collection of tables and charts covering health and safety in the U.S. construction industry, as well as considerable economic and training data.
2007
Section 47: OSHA’s Enforcement of Construction Safety and Health Regulations
Since its establishment in 1970, the U.S. Occupational Safety and Health Administration (OSHA) has been responsible for the enforcement of workplace safety and health standards in the United States. OSHA enforces the standards or delegates such enforcement powers to 22 states and Puerto Rico.1 These OSHA state plans may have more stringent rules than federal OSHA standards.
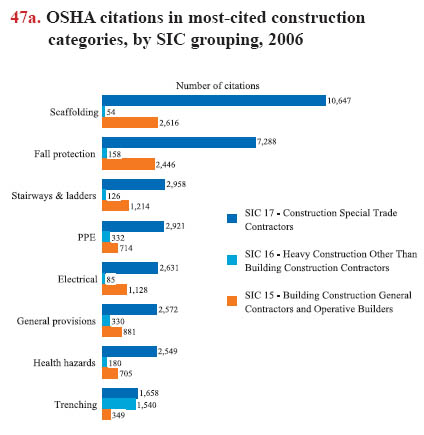
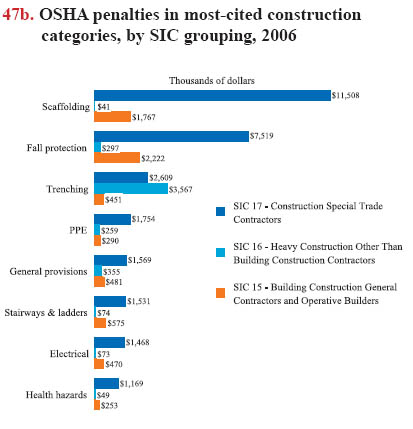
Since 1994, OSHA has focused its enforcement efforts in construction on fall protection, in an effort to reduce the leading cause of work-related deaths and injuries in the industry (charts 47a and 47b). (Some scaffolding-related violations involve fall hazards.)OSHA conducted 22,935 construction inspections in 2006. Of these, 1,265 (5.5%) covered health, rather than safety, although health inspections were 17% for all industries.2
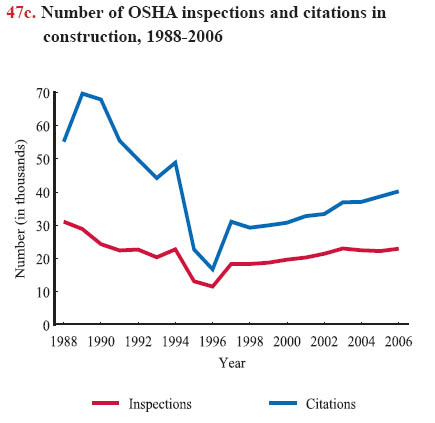
The number of OSHA construction inspections has decreased while the number of construction employers has increased. The number of inspections dropped in the mid-1990s, although it went up in 1997 and has increased slightly since that time (chart 47c). However, the 22,935 inspections performed in 2006 is actually 26% lower than the 31,073 in 1988. Meanwhile, the number of construction establishments (with payroll) increased about 47%, from 536,277 in 1987 to 787,672 in 2005.3 Also, the number of worksites visited is estimated to be much lower than the number of inspections, given that OSHA inspects an average of 3.5 employers on each construction site visited.4
OSHA had 2,400 inspectors in 2006, including state plan inspectors, for all industries nationwide.2 According to data from the U.S. Census Bureau, there were 7.5 million establishments in all U.S. industries in 2005.3 At best, there is one OSHA inspector for every 3,000 establishments in all industries.
Given its limited enforcement resources, OSHA appears to inspect some types of construction worksites more often than others, although data on current trends in OSHA inspection targeting are lacking. Using data from OSHA inspection reports from 1987-1993 for the nation's 2,060 largest construction contractors, including state-plan jurisdictions, a study found that OSHA was likely to inspect union contractors' sites about 10% more than non-union contractors. Study findings showed that OSHA devoted "a substantial percentage of its [enforcement] resources" to worksites of very large companies, even though compliance inspections of mid-size and smaller companies produced a higher proportion of citations.5 This study found that in 1993, 30% of the inspections from the sample produced serious violations, compared with 46% of all other construction inspections. OSHA's inspection-targeting procedures reportedly have not changed substantially since the years studied.2
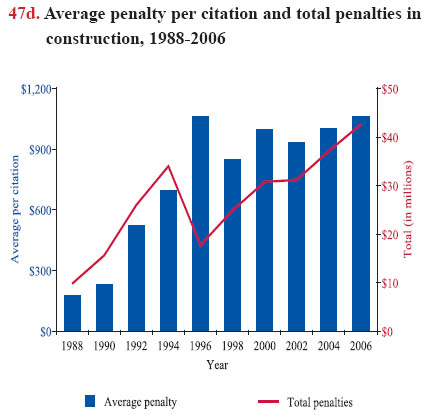
Between 1988 and 2006, penalties per citation increased six times, regardless of inflation (chart 47d), for at least two reasons. Congress enabled OSHA to increase maximum penalties allowable in the system in 1990. Secondly, penalties are listed as "current" and, if the fines are appealed, fines may be lowered.
Along with enforcement, OSHA has been working to encourage voluntary compliance by employers. The OSHA "focused inspection program," begun in 1994, is intended to allow compliance officers to spend more time on worksites where greater hazards may exist. These inspections only look at the four leading hazards. In order for employers to qualify for a focused inspection, they must have already put in place an effective safety and health program. In 2006, 6% of OSHA construction inspections were classified as "focused."2 Also, in 2006, OSHA Training Institute outreach training courses on safety and health provided 10- and 30-hour training for approximately 350,000 construction workers.6 OSHA also awarded grants to train hard-to-reach construction workers and those at high risk of getting work-related injuries and illnesses.
Along with enforcement, OSHA has been working to encourage voluntary protection by contractors - for instance, through focused inspection initiatives - and to highlight successful safety and health programs. OSHA non-enforcement activities include OSHA Training Institute courses on safety and health, which provided 10- and 30-hour training for 169,560 construction workers in 2001, and training grants to reach construction workers who might be particularly hard to reach or at high risk of work-related injuries and illnesses.
The effectiveness of OSHA's efforts in reducing injuries and illnesses in construction remains unknown. As OSHA reported to Congress in 1997, the agency has lacked data to show whether its programs improve safety and health at worksites.7 A report prepared for OSHA in 2002 described efforts to develop a measure of effectiveness by comparing a site's lost-workday injury and illness rates before an OSHA intervention with rates in the two years following.8 The report, however, pointed out the difficulty of measuring results in construction, given that few construction sites exist for as long as three years.
Download MS PowerPoint versions of Charts
1. Occupational Safety and Health Administration (OSHA), http://www.osha.gov/dcsp/osp/index.html (Accessed November 2007).
2. John Franklin, OSHA Directorate of Construction (Personal communication, September 2007).
3. The 1987 data are from the U.S. Census Bureau. Census of Construction Industries, 1987, United States Summary, Establishments with and without payroll. CC87-1-28. 4. March 1990. The 2005 data are from the County Business Patterns, http://censtats.census.gov/cgibin/ cbpnaic/cbpsel.pl (Accessed November 2007).
4. Knut Ringen. 1999. Scheduled Inspections in Construction: A Critical Review and Recommendations. Report Prepared for The Directorate of Construction, Occupational Safety and Health Administration, in response to Contract No. B9F91522, pg. 15. The estimate of employers visited per site excludes state-plan jurisdictions.
5. David Weil. 2001. Assessing OSHA Performance: New Evidence from the Construction Industry. Journal of Policy Analysis and Management, 20(4):651-674.
6. OSHA Directorate of Training and Education outreach training program guidelines for the construction industry, October 2007, http://www.osha.gov/dte/outreach/construction/focus_four/constrfocusfour_introduction.pdf (Accessed November 2007).
7. Occupational Safety and Health Administration. 1997. Strategic Plan: Occupational Safety and Health Administration FY 1997-FY 2002.
8. The Lexington Group and Eastern Research Group. 2002. An Estimate of OSHA's Progress from FY 1995 to FY 2001 in Attaining its Performance Goal of Reducing Injuries and Illnesses in 100,000 Workplaces. Prepared for The Office of Statistics, Occupational Safety and Health Administration, Washington, D.C., Contract No. J-9-F-7-0043.
Note:
All charts - Years are fiscal years. SIC is the Standard Industrial Classification (see Glossary). Charts 47a and 47b - Data covers categories having the largest number of citations and highest penalties. Citations and penalties were assessed by OSHA only, not state-plan OSHA programs. "Scaffolding" refers to citations within subpart L, "Fall protection" refers to citations within subpart M, "Stairways and ladders" refers to citations within subpart X, "Trenching" refers to citations within subpart P, "PPE" refers to citations within subpart E, "Electrical" refers to citations within subpart K, "General provisions" refers to citations within subpart C, and "Health hazards" refers to citations within subparts D and Z.
Charts 47b and 47d - Penalties listed are current rather than initial assessments. Penalties reported for the most recent years may be lowered in some cases after employers contest penalties.
Chart 47d - Dollar values are not adjusted for inflation.
Source:
Charts 47a and 47b - Occupational Safety and Health Administration, www.osha.gov (Accessed November 2007). Charts 47c and 47d - OSHA Directorate of Construction, Washington, D.C. (Personal Communication, September 2007).
Back to Table of Contents