
Summary Statement
A broad collection of tables and charts covering health and safety in the U.S. construction industry, as well as considerable economic and training data.
2007
Section 4: Value Added and Spent in the Construction Industry
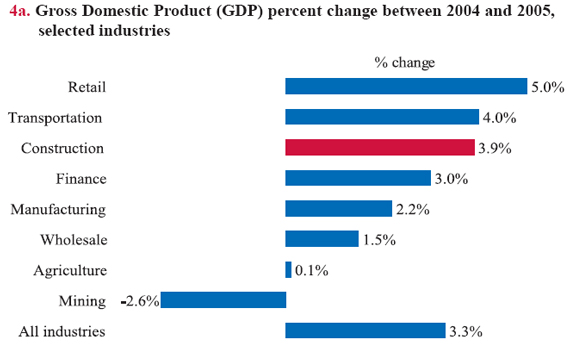
Construction produced 4.9% of the total Gross Domestic Product (GDP) in 2005, an increase from 4.6% in 2002 and 4.1% in 1997.1 An industry's contribution to GDP is measured by its value added, which is equal to its gross output minus its intermediate purchases (see Glossary) from other industries. Real value added is adjusted for deflation. Construction was the only private goods-producing industry (see Glossary) with a strong growth in 2005 (chart 4a), and the value added by construction totaled $611.1 billion (2005 dollars).
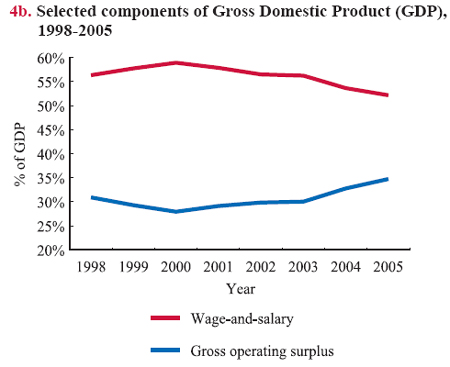
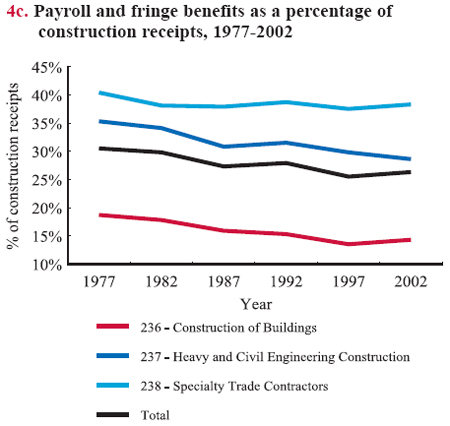
Value added by industry in GDP can also be measured as the sum of compensation of employees, taxes on production, imports less subsidies, and gross operating surplus. Compensation of employees is the sum of wages and salaries, employer contributions for employee pension and insurance funds and government social insurance. Gross operating surplus includes consumption of fixed capital, proprietors' income, corporate profits, and business current transfer payments (net). Although the value added by construction increased in recent years, wage-and-salary (as a proportion of the value added) decreased from 56% in 1998 to 52% in 2005, while the gross operating surplus grew gradually during the same period (chart 4b).Data from the Economic Census shows a similar trend over a longer time period. From 1977 to 2002, there has been a general decline of payroll and benefits as a proportion of construction receipts (or receipts from construction work, one of the three categories used by the Economic Census, accounting for 99% of business done by construction; see chart book pages 2 and 3). Of the three major construction sectors, Construction of Buildings (NAICS 236) consistently yielded the lowest percentage of payroll and benefits, and the proportion declined from 18.7% in 1977 to 14.3% in 2002. For the total construction industry, the proportion of payroll and benefits declined by 13.8% since 1977 (chart 4c), reflecting a growth in spending on other categories.
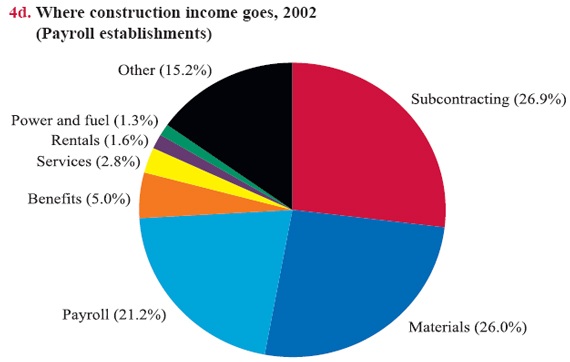
Subcontracting remains the largest expense category for payroll employers. On average, 27% of the dollar value of payroll establishments was subcontracted in 2002 (chart 4d). Labor payroll and benefits cost $314.3 billion, making up the second largest group of expenses. Payroll was $254.3 billion and fringe benefits were $60.0 billion. (The U.S. Census Bureau does not detail the components of the subcontracting category.) As some types of establishments subcontract a large share of their work, they produce a disproportionately high output compared with the number of their employees. For instance, nonresidential building construction (NAICS 2362), which had 11% of payroll employees, produced $259 billion, or 22% of the value of work from payroll establishments in 2002. Yet, 54% of the work produced by this sector (NAICS 2362) was subcontracted that year.
Some Census Bureau numbers for construction may differ from data produced in other reports by the Census Bureau or other government agencies because of varying scope, coverage, timing, classification, and methodology. For instance, the census publication series, Construction Spending, covers only new construction put in place without regard to who is performing the construction activity (see chart book pages 5 and 6).
Download MS PowerPoint versions of Charts
1. Thomas F. Howells III, Kevin B. Barefoot, and Brian M. Lindberg, Annual Industry Accounts, Survey of Current Business, December 2006.
Note: All charts - Data cover the private sector only.
Source:
Chart 4a - Bureau of Economic Analysis, News Release: Gross Domestic Product by Industry, 2003-2005 (revised), Table 1, http://bea.gov/bea/newsrelarchive/2006/gdpind05_rev.htm (Accessed November 2007).
Chart 4b - Bureau of Economic Analysis, Industry Economic Accounts, Gross-Domestic-Product-(GDP)-by-Industry-Data, http://www.bea.gov/industry/gdpbyind_data.htm (Accessed November 2007).
Chart 4c - U.S. Census Bureau, 2002 Economic Census and previous years, Industry Summary, Construction Subject Series. Personal contact: Tamara Cole, U.S. Census Bureau.
Chart 4d - U.S. Census Bureau, 2002 Economic Census, Construction Subject Series, Table 3, October 2005 (EC02-23SG-1), http://www.census.gov/prod/ec02/ec0223sg1.pdf (Accessed November 2007).
Back to Table of Contents