
Summary Statement
A broad collection of tables and charts covering health and safety in the U.S. construction industry, as well as considerable economic and training data.
2007
Section 5: The Value of Private- and Public-Sector Construction
The U.S. Census Bureau publishes a construction statistics series, Construction Spending (also known as the Value of Construction Put in Place). Preliminary data are published monthly and quarterly, in advance of complete annual reports. For 2005, Construction Spending set the annual value of construction at $1,132 billion, in contrast with other data sources, such as the Economic Census – Construction series (see chart book pages 2, 3, and 4).
The differences in the values reported for construction result from differing survey and estimation methods. The major difference is that Construction Spending measures the value of construction currently being installed or erected, whereas the Economic Census measures and provides information on the receipts, expenditures, and characteristics of establishments performing the construction work.1 The Economic Census uses receipts for construction work done by establishments in the construction industry. By contrast, Construction Spending includes work done by projects in any industry, and is based on ownership, which may be public or private. This series also covers new construction and major replacements, such as the complete replacement of a roof or heating system. If a construction project extends before or after the time covered, the project's value is adjusted, based on input from the owner.Construction Spending includes costs of (1) materials installed or erected, (2) labor, (3) construction rental equipment, (4) the contractor's profit, (5) architectural and engineering work, (6) miscellaneous overhead and office costs chargeable to the project on the owner's books, and (7) interest and taxes paid during construction (except state and locally owned projects).
Costs such as the complete replacement of a roof or heating system are included, but not the costs of production machinery, such as heavy industrial machinery, printing presses, stamping machines, bottling machines, and display cases and shelving in stores. Also not included are the costs of drilling gas and oil wells, including the construction of offshore drilling platforms and the digging and shoring of mines. Although additions and renovations are counted, maintenance and repairs to existing structures or service facilities are not. While modular homes are included, mobile homes are not.
Construction Spending classifies projects as privately owned or government owned during construction. Private construction is categorized as residential, nonresidential, farm nonresidential, public utilities, and all other privately owned nonbuilding projects. Public construction consists of housing and redevelopment, educational, hospital, highways and streets, conservation and development, sewer systems, water supply, other buildings, and miscellaneous non-buildings.
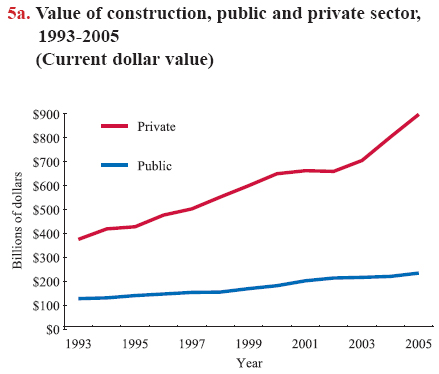
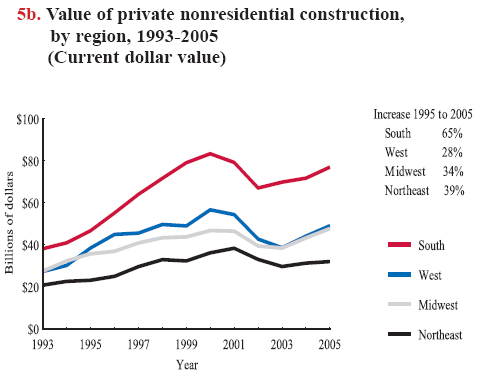
As measured by Construction Spending, the value of private construction has grown faster than that of public construction since 1993 (chart 5a). In 2005, the value of private construction was $898 billion, compared with $234 billion for public construction, a ratio of 3.8 to 1, while it was 3.0 to 1 in 1993.2 When the growth of privately owned nonresidential construction is compared by region during this time period, the South has the most growth (chart 5b).
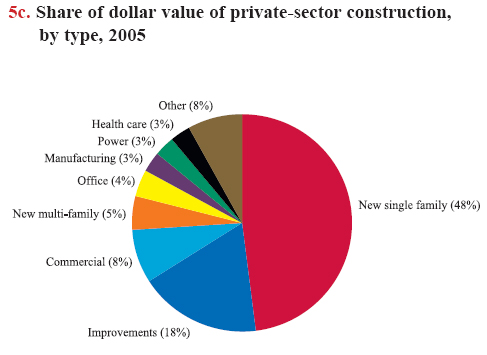
The largest share of private construction, new single-family residential buildings, totaled $433.5 billion (48%) in 2005 (chart 5c). The second largest category of private construction pertains to major improvements, such as a new roof, which totaled $160.5 billion (18%). Repairs to an existing roof, however, are not counted by Construction Spending as an improvement. "Other" private construction includes lodging, educational, religious, public safety, amusement and recreation, transportation, communication, sewage and waste disposal, water supply, highway and street, and conservation and development.
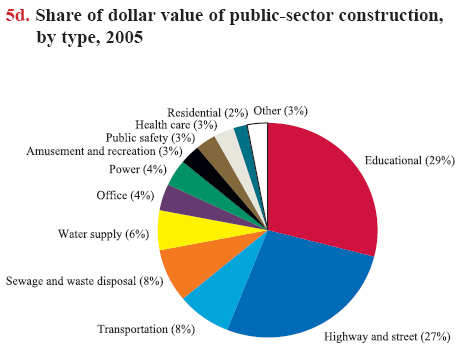
In the public-sector, construction of educational facilities accounted for the largest share of dollar value, 28.6%, at $66.9 billion in 2005 (chart 5d). Highway and street construction was close behind at $63.8 billion, encompassing 27.2% of public construction. "Other" public construction includes commercial, conservation and development, lodging, religious, communication, and manufacturing.
Download MS PowerPoint versions of Charts
1. Tamara Cole. 2002. Reconciling Construction Data: A Comparison of the Value Put in Place Series, the 1997 Economic Census and the 1998 Annual Capital Expenditures Survey. U.S. Census Bureau, Manufacturing and Construction Division, http://www.census.gov/mcd/vip_csec_9798.pdf (Accessed November 2007).
2. Figures on this page are in current dollars.
Note:
Chart 5a - Public and private construction totaled $1,132 billion, according to Construction Spending (2005 dollars).
Chart 5b - Private nonresidential construction totaled $205 billion in 2005. The states and the District of Columbia are divided into regions as follows: Connecticut, Maine, Massachusetts, New Hampshire, New Jersey, New York, Pennsylvania, Rhode Island, and Vermont – Northeast; Alabama, Arkansas, Delaware, District of Columbia, Florida, Georgia, Kentucky, Louisiana, Maryland, Mississippi, North Carolina, Oklahoma, South Carolina, Tennessee, Texas, Virginia, and West Virginia – South; Illinois, Indiana, Iowa, Kansas, Michigan, Minnesota, Missouri, Nebraska, North Dakota, Ohio, South Dakota, and Wisconsin – Midwest; Alaska, Arizona, California, Colorado, Hawaii, Idaho, Montana, Nevada, New Mexico, Oregon, Utah, Washington, and Wyoming – West.
Chart 5c - Private-sector construction was $898 billion in 2005 (2005 dollars).
Chart 5d - Public-sector construction totaled $234 billion in 2005 (2005 dollars).
Source: All charts - U.S. Census Bureau, Construction Spending, November 2007, http://www.census.gov/const/www/c30index.html (Accessed November 2007).