
The Role of Supervisors in Behavioral Safety Observations
Summary Statement
Discusses the importance of having supervisors and managers involved in safety observations and provides evidence that this practice improves safety on construction sites.
Safety professionals have long recognized the importance of management support and involvement in achieving effective safety improvement. Petersen, for example, strongly advocates an approach in which management takes a central role in safety improvement efforts. “Management’s reaction to change determines [the] success [of change],” he says. “When upper management ‘buys in’ to the changes, it ensures success” (278). He also states, “Another way in which behavior is strongly influenced is through modeling (learning by imitation). The research on modeling tells us that if we want to maximize approach (rather than avoidance) tendencies in workers, we must exhibit that behavior ourselves” (266).
Clearly, both managers
and supervisors must strive to demonstrate safe work practices and make
decisions that reflect a commitment to safety. In recent years, however,
management’s role in behavioral safety interventions has been the
subject of much debate. At some companies, front-line supervisors conduct
behavioral observations; in other cases, supervisors participate in educational
workshops to learn about the observation process, yet do not conduct observations.
Over the past 20 years, author McSween has worked with various organizations that have adopted different strategies for involving supervisors in the observation process. Based on these experiences, the authors have concluded that supervisors and managers should generally conduct observations as part of a behavioral safety process.
Safety leadership
is vital—be it from formal or informal leaders throughout an organization.
Formal leadership includes supervisors and managers. Informal leaders
are employees who take a special interest in safety; they are often union
leaders and other employees who are well-respected by coworkers.
Both types of leaders share important responsibilities for supporting safety. To maximize the success of behavioral safety improvement efforts, leadership responsibilities must be defined for both formal and informal leaders.
Leaders, particularly supervisors, often have the following responsibilities in a behavioral safety process:
- Ensure that employees have time to 1) conduct observations; 2) participate in safety meetings; and 3) participate in applicable committee meetings.
- Encourage participation.
- Ensure completion of safety-related work orders and communicate the status of such work orders to employees.
- Ensure that observation data is reviewed during safety meetings.
- Provide positive feedback to employees who participate in observations.
- Deliver frequent, consistent feedback— both positive and corrective—for safety practices.
Although these roles are fairly common across organizations, the question of whether formal leaders should participate in observations is more controversial. Table 1 outlines typical options for the involvement of formal leaders in safety observations in facilities where participation as an observer is voluntary for employees (McSween). Unfortunately, however, the current literature presents no empirical evidence regarding the involvement of supervisors and other formal leaders in conducting observations.
IMPLICATIONS FROM
LEADERSHIP RESEARCH
Although no research studies have addressed these issues, several empirical
studies in the area of leadership suggest the importance of involving
supervisors and managers in conducting observations (Komaki, et al).
One experimental study in particular illustrates the impact of leadership practices on employee performance and attitudes. In this study, mail sorters in a post office were randomly assigned to one of three groups. The supervisor was then instructed to 1) observe their work; 2) provide feedback without observing; or 3) observe work and provide feedback. The researchers then examined the impact of each practice on the accuracy of employees' mail-sorting tasks. They found that employees who received feedback following observations performed at a higher level of accuracy than the other two groups.
TABLE 1 Role of Supervisors in Conducting Behavioral Observations
| At some companies, front-line supervisors conduct behavioral observations; in other cases, they participate in educational workshops to learn about the observation process, yet do not conduct observations. The authors believe that supervisors should conduct observations as part of a behavioral safety process. |
OPTIONS
|
CONSIDERATIONS
|
| Formal leaders do not participation observations | Used primarily in low-trust organizations. Helps reduce initial resistance to behavioral safety initiatives | |
| Formal leaders voluntarily conduct observations |
Often selected
by organizations that are working on reducing barriers between employees
and supervision |
|
| Observations are a part of the job of all formal leaders |
Appropriate for most high-trust organizations when observations can be viewed as an opportunity for leaders to interact with employees on the topic of safety Participation of formal leaders typically included in performance appraisals |
Next, the researchers
met with employees and discussed their reaction to supervision. Employees
who received feedback following observations offered significantly more
positive statements and significantly fewer negative comments compared
with the other two groups. In short, when supervisors directly observed
employee performance and provided specific feedback based on those observations,
employees performed better and had more positive attitudes toward supervision
(Komaki, et al).
In the authors’ opinion, this research implies that supervisor/manager participation— directly conducting behavioral observations and providing feedback—in the safety process should produce better safety performance and more-positive attitudes by employees toward formal leadership.
A NATURALLY OCCURRING
EXPERIMENT
In 1998, the authors conducted a field study on the role of leadership
within Chevron Canada Resources (CCR). CCR had 23 teams of employees working
at 15 gas production plants and fields—14 in Alberta, one in Manitoba.
With the help of outside consultants, a cross-functional design team planned and piloted a behavioral safety process at three locations in 1997, then extended the process to the other locations in 1998. Author Cook was the internal coordinator for the process and conducted observer training for employees, except at the pilot locations, where consultants provided the training.
Through training, participants were introduced to behavioral safety, received a detailed description of CCR's behavioral safety process (referred to as the Chevron Accident Reduction Environment, or CARE) and learned how to conduct observations. Trainers stressed that no disciplinary action would be taken as a result of observations.
To learn how to conduct
observations, participants viewed three short (two- to three-minute) videos
showing examples of actual work performance, and practiced using an observation
checklist to record data on behaviors and conditions in need of attention.
They then conducted role-playing exercises to develop skills needed to
effectively share their observations.
After all employees
at a location completed observer training, volunteers began to conduct
observations; they were asked to conduct two observations per month. Supervisors
participated in the same training and received the same instructions—including
being asked to conduct two observations each month.
After completing an observation, the observer returned the completed checklist to the employee who was the CARE representative for that location. These representatives were selected in various ways—some volunteered, some were nominated by coworkers, others were selected by supervisors. Their role was to ensure that data were recorded in a company- wide database and to review the data during safety meetings.
At the end of 1998, the 15 locations showed wide variations in the level of employee participation in observations. Informal comments about the involvement of site supervisors prompted a closer examination of their participation. Of the original 23 teams, the authors excluded two because they had no supervisor throughout the study and three maintenance teams that shared a common supervisor, resulting in a total of 18 experimental groups.
THE RESULTS
Data showed that
when site managers consistently performed scheduled safety observations,
their locations were more likely to have high levels of voluntary employee
participation. At locations where supervisors conducted 80 to 100 percent
of their observations (an average of 1.84 observations per month), 70
percent of employees conducted monthly safety observations. At locations
where supervisors conducted roughly one-half of their observations (an
average of 0.9 per month), 52 percent of employees conducted monthly observations.
At locations where supervisors conducted less than 20 percent of their
observations (an average of 0.1 per month), only 42 percent of employees
conducted monthly safety observations.
Figure 1 and Table
2 show the level of employee participation and the rate of supervisory
observations. Clearly, more employees conducted observations when their
supervisors actively participated by conducting observations. The differences
between participation levels shown in
Table 2 are statistically significant at the 0.01 level (chi-square=10.98).
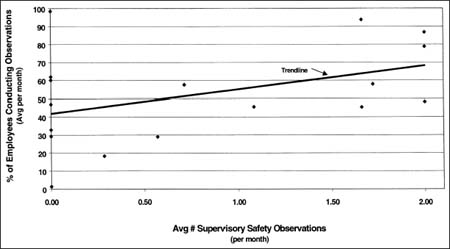
Figure 2 is a scatter diagram of data on employee participation relative to the level of supervisor participation; it shows both the trend line and the large variance in data. The correlation between supervisor observations and employee participation is 0.42 (which is also significant at the 0.01 level).
Behavioral safety was adopted at CCR as a strategy to increase employee involvement; the objective was to sustain exemplary safety performance and help prevent complacency that may exist when accidents are rare. CCR had a rate of 0.76 OSHA-recordable injuries in 1997 per 200,000 workhours and 0.79 in 1998. In 1999, the company's rate was 0.72.
DISCUSSION
In the authors’ opinion, several factors contributed to these results.
When supervisors conduct safety observations, they exemplify the behaviors
expected of subordinates. Such modeling is likely to help employees understand
that conducting observations is a practice which the organization supports
and expects.
In addition, participation ensures that supervisors understand the observation process. With such a foundation, they are more likely to support the process by ensuring that employees have time to participate and coach employees about their participation.
Participation also
enables supervisors to enhance their ability to provide feedback, and
increases the consistency of their feedback as well as its frequency.
Because of their status and position, supervisors are key members of the
working community; their feedback and support are, consequently, likely
to be critical.
Finally, supervisors
who conduct observations have a better understanding of equipment and
procedural issues that need to be addressed in order to support safety.
Consider this example, related by a supervisor who participated in the
Chevron process.
During a field observation, this supervisor observed crew members using a short pipe wrench with a cheater bar. He intervened to stop an employee from standing on the bar. Without the threat of disciplinary action during behavioral observations, the workcrew was able to show the supervisor how the job was typically executed. The supervisor realized he had previously denied requests to purchase new wrenches with longer handles; he subsequently approved their purchase. As this example illustrates, supervisors are often too far removed from actual practices in the workplace.
However, it should
be noted that the level of supervisor involvement via observations did
not account for all of the variability noted. Some groups with low supervisory
involvement had high levels of employee participation, while some groups
with high supervisory involvement had low levels of employee participation
(Table 2).
Informal assessment of the first kind of group suggests the need for informal leadership—from within employee ranks. For example, the coordinators of groups 1 and 6 actively promoted participation; they often invited other employees to conduct observations of work that they (the coordinators) were to perform. This finding suggests that the presence of an active informal leader may offset the absence of strong formal leadership. Although this study provided no direct evidence, the authors believe the lack of strong support from informal leadership—or perhaps even active resistance from key employees— may suppress the involvement of employees in groups with high leadership participation (e.g., groups 14 and 15).
TABLE 2 Individual Workgroup Data
Low Supervisor Participation
|
Work
Group
|
Average
No. of Employees
|
Months
in CARE
|
Average
No. of Observations per Month
|
Average
% of Employees Conduction Observations
|
Average
No. of Observations Completed by Supervisor
|
|
1
|
14
|
7
|
14
|
62
|
0.00
|
|
2
|
11
|
7
|
10
|
47
|
0.00
|
|
4
|
9
|
7
|
6
|
33
|
0.00
|
|
5
|
10
|
7
|
0
|
1
|
0.00
|
|
6
|
9
|
7
|
19
|
98
|
0.00
|
|
7
|
8
|
7
|
9
|
60
|
0.00
|
|
8
|
10
|
7
|
6
|
29
|
0.00
|
|
9
|
15
|
7
|
3
|
18
|
0.29
|
|
10
|
14
|
7
|
7
|
29
|
0.57
|
| Average |
42
|
0.10
|
Moderate Supervisor Participation
|
Work
Group
|
Average
No. of Employees
|
Months
in CARE
|
Average
No. of Observations per Month
|
Average
% of Employees Conduction Observations
|
Average
No. of Observations Completed by Supervisor
|
|
11
|
7
|
7
|
9
|
58
|
0.71
|
|
12
|
18
|
12
|
16
|
46
|
1.08
|
| Average |
52
|
0.90
|
High Supervisor Participation
|
Work
Group
|
Average
No. of Employees
|
Months
in CARE
|
Average
No. of Observations per Month
|
Average
% of Employees Conduction Observations
|
Average
No. of Observations Completed by Supervisor
|
|
13
|
8
|
12
|
10
|
94
|
1.66
|
|
14
|
18
|
12
|
15
|
46
|
1.66
|
|
15
|
48
|
7
|
56
|
58
|
1.72
|
|
16
|
18
|
9
|
17
|
48
|
2.00
|
|
17
|
22
|
12
|
32
|
79
|
2.00
|
|
18
|
10
|
10
|
17
|
87
|
2.00
|
| Average |
70
|
1.84
|
Informal leaders also help support supervisory involvement. For example, CARE coordinators from groups 13 and 17 reported that they actively prompted the involvement of supervisors. One routinely placed an observation checklist on the supervisor’s desk 10 days before the end of the month.
Figure 1.
Employee Observations as a Function of Supervisor Observations
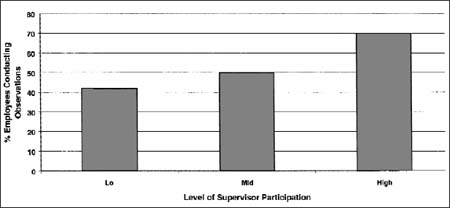
Figure 2.
Employee Participation as a Function of Supervisor Observations
CONCLUSION
The findings detailed here suggest the importance of both formal and informal
leader involvement in behavioral safety initiatives. However, since this
was a case study rather than a formal experiment, it cannot prove a causal
relationship between the involvement of leaders and employees.
Other factors could plausibly account for the participation of both supervisors and employees; thus, the role of leadership warrants further empirical study. Data can easily be interpreted as supporting the importance of effective leadership beyond simple participation in observations. For example, effective leaders may both participate more readily in observations and encourage greater participation, a notion supported by the current data. Sites with effective leadership might be expected to volunteer more readily for participation in a behavioral safety process.
As Table 2 shows, sites with high supervisory participation did indeed volunteer more quickly when the initiative was introduced, as indicated by the greater number of months in the process. Many locations in the high supervisory participation group were involved in the process for 12 months, which indicates that they volunteered early on. All locations in the low supervisory participation group were involved for only seven months.
Additional research is needed to explore these issues more thoroughly. Until then, this study suggests that practitioners should 1) include supervisors and managers in conducting observations as part of a behavioral safety process and 2) formally promote the support of informal leaders from the ranks of employees.
REFERENCES
Komaki, J.L. Leadership From an Operant Perspective. New York:
Routledge, 1998.
Komaki, J.L., M.L. Desselles and S. Schepman. “Testing Critical Linkages
in the Operant Model of Effective Supervision: Assessing Subordinate Performance
and Attitudes.” Paper presented at the Conference of the Society
of Organizational Behavior, Worthington, OH, Oct. 1998.
McSween, T.E. The Values-Based Safety Process: Improving Your Safety
Culture With a Behavioral Approach. New York: John Wiley & Sons,
1995.
Petersen, D. Human Error Reduction and Safety Management. 3rd ed.
New York: Van Nostrand Reinhold, 1996.
Scott Cook
is an internal safety consultant with Chevron Research & Technology.
During
1996, he helped Chevron Canada Resources plan and develop a behavioral
safety process,
eventually called Chevron’s Accident Reduction Environment (CARE).
After developing the initial plan, Cook moved to Calgary, Alberta, where
he served as the CARE coordinator through 1998. He is currently working
with Chevron to improve safety
in the company’s facilities in Angola.
Terry E. McSween,
Ph.D., is president and cofounder of Quality Safety Edge, a Missouri City,
TX-based company that helps organizations improve safety and leadership
through behavioral psychology. McSween is author of The Values-Based Safety
Process. He is a member of ASSE’s Gulf Coast Chapter.