
Summary Statement
A multifaceted study of occupational safety culture and habits in the Irish construction industry.
2002
The Prevention of Falls from Heights
Unguarded OpeningsFive sites out of the eighteen prevented any unguarded openings from occurring. A further six sites had less than 15% of openings left unguarded. Two sites had all openings left unguarded. Table 10 shows these incidences and how they breakdown.
| Number of Sites | Percentage of Openings Found Unguarded |
| 5 | 0 |
| 6 | 0-15 |
| 4 | 15-25 |
| 1 | 25-45 |
| 2 | 100 |
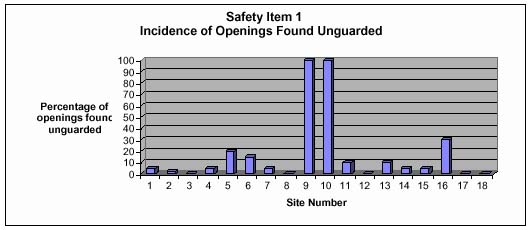
Figure 1: Incidence of openings found unguarded
Missing Guardrails and Edge Protection
Two sites out of eighteen had complete edge protection and seven sites had less than 15% of requisite guard rails or edge protection missing. Eleven out of eighteen sites had more than 15% of the guardrails or edge protection missing.
| Number of Sites | Percentage of Missing Guardrails or Edge Protection |
| 2 | 0 |
| 2 | 1-5 |
| 3 | 5-15 |
| 7 | 15-25 |
| 2 | 25-35 |
| 1 | 45-55 |
| 1 | 55-65 |
Table 11: Incidence of sites with missing guardrails or edge protection
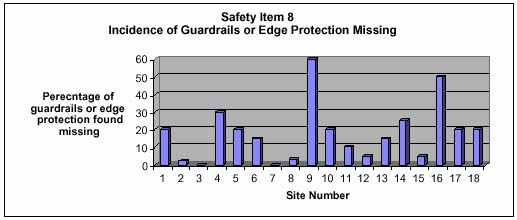
Figure 2: Incidence of guardrails or edge protection missing
Short or Defective Ladders
There were no instances of ladders being either to short for use or defective in any way.
Ladders not tied
Nine sites had ladders that were found to be incorrectly tied. Site 9, as a special case for comment, had one ladder alone on site, in use during the survey.
| Number of Sites | Percentage of ladders found incorrectly tied |
| 9 | 0 |
| 3 | 1-5 |
| 5 | 6-20 |
| 1 | 100 |
Table 12: Incidence of sites with incorrectly tied ladders
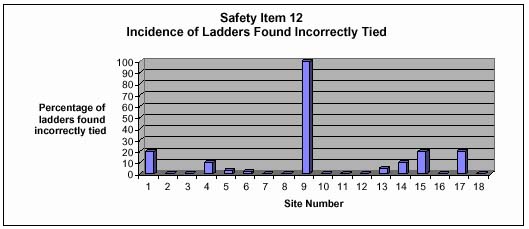
Figure 3: Incidence of ladders found incorrectly tied
Safe use of ladders
Three sites had incidences where operatives were observed using ladders in an unsafe manner. In all incidences this was the use of untied ladders.
Scaffold / Ladder Misuse
Three sites had incidences where operatives were observed misusing scaffolding. In all incidences this was not using ladders to access scaffolding lifts on different levels.
Operatives misusing ladders or scaffold were observed on six sites. However this figure must be treated with caution due to the survey duration and the limitations of the researcher in continuously observing all operatives.
Prevention of Falls Performance by site
For the prevention of falls from height, those items in the compliance measure related to the category were averaged, and mean and standard deviations of noncompliance performance per site were calculated. This measure of falls performance can be used to rank the sites against each other (see table 13).
As can be deducted from the ranking of sites in terms of falls performance and the site characteristics, the location size or stage of construction do not show any apparent pattern with regard to ranking (an so to compliance with falls prevention).
| Ranking | Site No. | Location | Builder | Mean
Non Compliance Rate |
Standard Deviation |
| 1 | 3 | Dublin | General Contractor | 0 | 9.45 |
| 2 | 8 | Dublin | General Contractor | 0.43 | 0.98 |
| 3 | 2 | Dublin | General Contractor | 0.57 | 0 |
| 4 | 7 | Dublin | Housing | 0.71 | 10.29 |
| 5 | 12 | RoI | General Contractor | 0.71 | 9.27 |
| 6 | 18 | Belfast | Housing | 2.86 | 6.99 |
| 7 | 11 | RoI | Housing | 3.57 | 1.89 |
| 8 | 13 | Belfast | General Contractor | 4.29 | 1.13 |
| 9 | 15 | Belfast | General Contractor | 4.29 | 48.21 |
| 10 | 6 | Dublin | Housing | 4.86 | 37.29 |
| 11 | 14 | NI | General Contractor | 5.71 | 4.76 |
| 12 | 17 | Belfast | Housing | 5.71 | 1.89 |
| 13 | 5 | Dublin | Housing | 6.57 | 6.07 |
| 14 | 1 | Dublin | General Contractor | 8.57 | 9.32 |
| 15 | 4 | Dublin | General Contractor | 8.57 | 7.32 |
| 16 | 16 | NI | Housing | 11.43 | 20.35 |
| 17 | 10 | RoI | Housing | 17.14 | 9.76 |
| 18 | 9 | RoI | General Contractor | 37.14 | 7.56 |
Table 13: Ranking of sites by prevention of falls performance
Tables 14 and 15 break down the incidence of unguarded openings and missing handrails/edge protection for general contractor and house builders. Overall, both missing handrails and missing edge protection were higher on house building sites.
| Site No. | Location | Percentage
of openings found unguarded |
Percentage
of guardrails edge protection missing |
| 1 | Dublin | 5 | 20 |
| 2 | Dublin | 2 | 2 |
| 3 | Dublin | 0 | 0 |
| 4 | Dublin | 5 | 30 |
| 8 | Dublin | 0 | 3 |
| 9 | RoI | 100 | 60 |
| 12 | RoI | 0 | 5 |
| 13 | Belfast | 10 | 15 |
| 14 | RoI | 5 | 25 |
| 15 | Belfast | 5 | 5 |
| Average => | 13.2% | 16.5% | |
Table 14: Unguarded openings and missing guardrails/edge protection on general contractor sites
| Site No. | Location | Percentage of openings found unguarded | Percentage of guardrails edge protection missing |
| 5 | Dublin | 20 | 20 |
| 6 | Dublin | 15 | 15 |
| 7 | Dublin | 5 | 0 |
| 10 | RoI | 100 | 20 |
| 11 | RoI | 10 | 10 |
| 16 | NI | 30 | 50 |
| 17 | Belfast | 0 | 20 |
| 18 | Belfast | 0 | 20 |
| Average => | 22.5% | 19.4% | |
Table 15: Unguarded openings and missing guardrails /edge protection on housing sites.
General conclusions on Prevention from Falls from Heights
- The physical
prevention of falls encountered on the sites was variable. Compliance
ranges from very high to poor compliance.
- The physical
condition and placement of ladders on all sites was good. There were
no ladders observed in defective conditions or too short for the job.
- Two sites prevented
missing handrails or edge protection
- Five sites
prevented unguarded openings.
- Ladders were
not tied in eight out of the eighteen sites.
- The incidence
of observed scaffold or ladder misuse by operatives was low.
- In overall
terms housebuilders were more likely to have a higher incidence of
unguarded openings and missing guardrails/edge protection.
- In conclusion
the existing sources of safety influence acting on the 18 sites produced
2 sites out of 18 with all the required edge protection and 5 sites
out of eighteen with all requisite openings guarded.
- Whilst these figure would be subject to change during the life cycle of the construction phase, it points to current levels of safety influence on sites not being strong enough to prevent conditions allowing operatives to fall from heights.
- Missing scaffold
baseplates
- Misusing scaffolding
- Ladders to
short for the job in hand
- Misusing ladders
- Defective ladders
- Protective footwear
Rubbish on access routes
There was an overall pattern with regards to amount of rubbish found: mostly all sites performed well in terms of compliance with this item. 12 sites out of 18 had 15% or less of access routes obstructed and 6 sites out of 18 had 16-30% of access routes obstructed (see fig. 4).
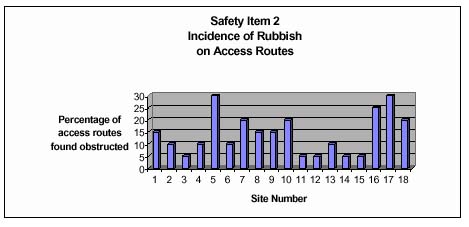
Figure 4: Incidence of rubbish on access routes
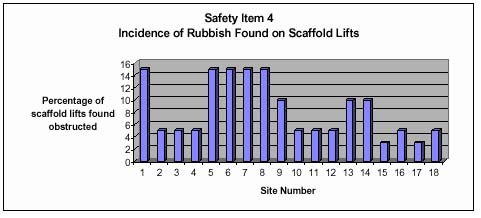
Figure 5: Incidence of rubbish on scaffold lifts
Rubbish on scaffold lifts
The second figure above shows the incidence of rubbish found on scaffolding lifts. No clear pattern here emerges with 10 out of 18 sites having 5% or less of scaffold lifts obstructed and 8 out of 18 sites having between 10 and 15 % of scaffold lifts obstructed (see fig. 5).
Trapped board and missing toe boards
Figures 6 and 7 show the incidence of trapped scaffold boards and missing toe boards per site. With regard to missing toe boards the incidence rate is generally even with a mean incidence of missing toe boards being 13.1% with a standard deviation of 6.96
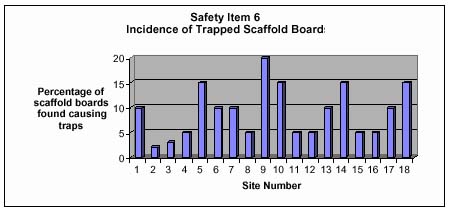
Figure 6: Incidence of trapped scaffold boards
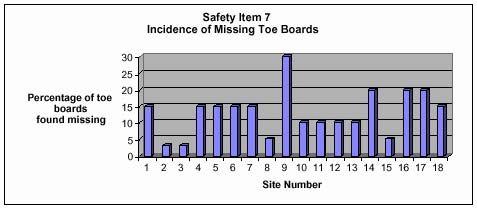
Figure 7: Incidence of missing toe boards
External hard hat wearing
With regards to wearing hard hats externally, 7 out of 18 sites had high compliance rates with 5% or less of operatives not wearing hard hats. 8 out of 18 sites had between 20% and 70% of operatives not wearing hard hats (fig. 8).
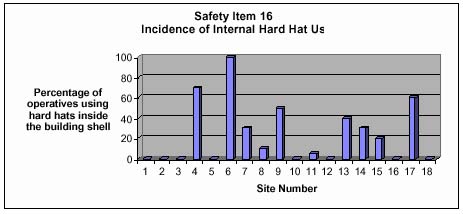
Figure 8: Incidence of internal hard hat use
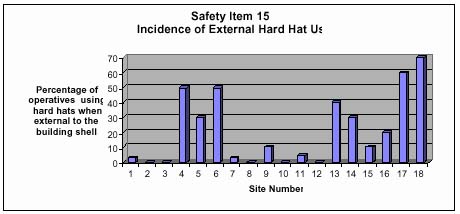
Figure 9: Incidence of external hard hat use
Internal hard hat wearing
9 sites out of 18 had 5% or less of operatives wearing hard hats internally. 7 sites out of 18 had between 15% and 60 % of non - compliance. 2 sites out of 18 had between 80-100% non - compliance.
Viz Vest wearing
Figure 10 shows the incidence of viz vest wearing and the results are variable across the sites. 8 out of 18 sites had 25% or less of operatives not wearing viz vests. 8 out of 18 sites had between 26% and 65% of operatives not wearing viz vests. 2 out of 18 sites had between 66% and 100% of operatives not wearing viz vests
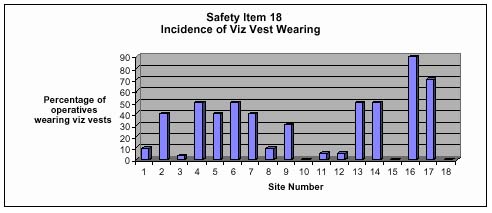
Figure 10: Incidence of viz vest wearing
With regards to hard-hat and viz vest wearing the results were variable across the sites. However those sites that had the best performance in terms of fall prevention tended to have a higher level of hard hat and Viz vest wearing.
Back to Contents