U.S. Construction Labor Productivity Trends, 1970-1998
Summary Statement
Study indicating that technological advances combined with depressed real wages increased construction labor productivity through the 1980s and 1990s.
1999
The main objectives of this report are to: (1) present an approach to studying long term productivity trends in the US construction industry; and, (2) provide a preliminary indication of such trends over the past 25-30 years. Subsequent, extended statistical studies are suggested that may be based on the approach of the selected work presented here. Labor cost and output productivity trends are tracked for tasks that represent different trades and differing levels of technological intensity within the building construction sector. A wide range of specific tasks were picked, from a zero technology impact task, hand trenching, to compaction with a sheepsfoot roller. Means cost manuals were used to trace the benchmark values for these tasks. These values reflect productivity trends. Unit labor costs in constant dollars and daily output factors were compared over decades for each task. Direct work rate data from 72 projects in Austin, Texas over the last 25 years were also examined. Increasing the direct work rate usually increases construction productivity.
The combined data indicate that productivity has increased in the 1980s and 1990s. Depressed real wages and technological advances appear to be the two biggest reasons for this increase. The data also indicate that management practices were not a leading contributor to construction productivity changes over time. Subsequent studies are required to add weight to these observations. They can be based on the approach presented here.
1.1 Background
1.2 Objectives
1.3 Scope
1.4 Methodology
Chapter
2: Review of Factors Affecting Construction Labor Productivity
2.1 Project Uniqueness
2.2 Technology
2.3 Management
2.4 Labor Organization
2.5 Real Wage Trends
2.6 Construction Training
Chapter 3: Case Study and Work Sampling Analysis
3.1 Case Studies3.2 Work Sampling Study
- 3.1.1. Framing Productivity in Housing Construction
- 3.1.2. Web Joist Productivity in Commercial Construction
- 3.1.3. Compaction Productivity in Heavy Construction
- 3.1.4. Hand-Trenching
- 3.1.5. Welded Steel Pipe
- 3.1.6. Acoustic Ceiling Tiles
Chapter
4: Findings and Future Work
4.1 Summary of DataAppendix A: Bibliography
4.2 Productivity Case Studies Indicate an Overall Upward Trend
4.3 Study Agreement with Broader Indicators
4.4 Wage Adjustment Issues and Problems Using Economic Time Series Data
4.5 Recommended Further Research
4.6 Conclusions
4.7 Recommendations
Figure
2.1: Trends in Real Wages
Figure 3.1: Housing Startsand Framing Labor Costs
Figure 3.2: Framing Output and Labor Costs
Figure 3.3: Open Web Joist Output and Unit Labor Costs
Figure 3.4: Compaction Output and Labor Costs
Figure 3.5: Unit and Daily Equipment Costs for Compaction
Figure 3.6: Hand Trenching Output and Labor Costs
Figure 3.7: Welded Steel Pipe Daily Output and Unit Labor
Costs
Figure 3.8: Historical Trends in Welded Steel Pipe Output
and Daily Equipment Costs
Figure 3.9: Ceiling Tile Output and Unit Labor Costs
Figure 3.10: Annual Sample Mean of Direct Work
Figure 4.1: Change in Output and Unit Labor Costs 1974-1996
Figure 4.2: Construction log(TFP) 1970-1987, General Contractor
Wages 1970-1996
Figure 4.3: Hand-Trenching Wages, Using CPI and GDP as
Inflation Deflators 24
Labor productivity is of central importance to the economic health of the United States' economy. Due to the size of the construction industry, productivity changes within it have significant direct effects on the national productivity and economic well-being of the US. In 1997, new-construction-put-in-place accounted for roughly 7% of the GDP, and if one includes remodeling and repair work the total rises to over 10% of GDP (Barry, 1998). In addition, over 10 million people are employed in the US construction industry including design, new construction, renovation construction, equipment and materials manufacturing, and supply. Thus, the design and construction industry is the largest manufacturing industry in the United States (Bernstein and Lemer, 1996).
This influence explains why many have expressed concern over productivity in the construction industry. Perceptions of productivity trends vary widely within engineering academia, industry, and economic academia. One seminal industry document has influenced the belief that construction labor productivity has been decreasing for decades (Business Roundtable, 1988). Current perceptions of those in industry have not been well quantified, however two industry leaders have stated that productivity has increased in the last 20 years (T. Kennedy, Chairman of BE&K Inc.; and D. McCarron, President of International Brotherhood and Carpenters and Joiners, Oct. 30, 1998, Austin, TX.). Economists are split, with many questioning the existence of any construction productivity decline (Eisner, 1994; Griliches, 1988), while others speculate as to the causes. Clearly there is a lack of agreement and understanding concerning this critical issue. Construction labor productivity remains one of the least understood factors in the American economy. As a reflection of this, The Bureau of Labor Statistics (BLS) maintains productivity indices for all significant sectors of the economy except for the construction sector. The BLS states this is due to a lack of "suitable data"(Jablonski, 1998).
There has been much work identifying the factors that affect productivity. Ineffective management has been cited as the primary cause of poor productivity rather than an unmotivated and unskilled workforce (Sanvido, 1983). Consequently, there has been significant research on how to make management more effective in supporting craftsworkers in the field. There is no doubt that management effectiveness ultimately determines profitability in most cases. Four primary ways of increasing productivity through management include: (1) planning; (2) resource supply and control; (3) supply of information and feedback; and (4) selection of the right people to control certain functions (Sanvido, 1983).
This report has two main objectives. First, a method is proposed to study long-term productivity trends in the US construction industry. Using this method, an analysis of the productivity trends over the past 25-30 years is then presented. Additional statistical analysis based on the approach of the selected study presented here is underway.
The American Association of Cost Engineers defines productivity as a "relative measure of labor efficiency, either good or bad, when compared to an established base or norm." While this relative nature of productivity creates great difficulties in tracing it as an absolute value over time, it is possible to gather information on movements of the established base, or benchmark, values. This report focuses on such benchmark values. Occasionally, productivity changes over a period of time necessitate adjustment of the benchmark so that it continues to provide a realistic and useful point of reference. As such, changes in the benchmark values reflect broader trends in the nature of productivity itself.
The benchmark values considered for the purposes of this study were the unit labor cost and unit output figures given in Means Building Construction Cost Data, published by R.S. Means Company. Contractors lacking complete internal data use these numbers as reference values for purposes of cost estimation. These measures reflect two different types of productivity. Unit labor cost figures provide an indication of productivity as it relates to capital resources. Unit output figures measure efficiency of labor application on the job site.
From a national perspective, output growth in the economy as a whole has varied in rate over the past several decades (US Bureau of Labor Statistics, 1998). During the expansion of the early post-WWII period, output per labor hour grew at an average rate of 2.8%. It slowed considerably during the 1970s, however. Following this slowdown, output has only grown at an average of 1.1% yearly. In the late 1990s, output has grown more swiftly again, but it is difficult to determine if this will be a long-term trend.
In order to develop an approach to studying long-term construction labor productivity trends, an initial decision was made to: (a) choose a limited number of representative tasks and (b) to use a long series of work sampling studies to track direct work rate. Selection of tasks to be studied was focused on achieving a range of technological intensity while maintaining variety in terms of trade and sector. Technological intensity of a task is roughly defined as the ratio of equipment to labor cost per unit output. A more thorough definition might account for other factors as well, such as complexity, skill level required, planning required, and interaction with other tasks. For subsequent studies, technology should be precisely defined and its measurement specified.
In covering heavy construction, soil compaction by sheepsfoot roller was chosen. This provided an example of a task in which technology has played a remarkable role in productivity change. At the other extreme, hand-trenching was included due to its inherent lack of technological change. This task also reveals real monetary compensation trends for the very lowest paid construction labor. Data for steel pipe installation and acoustic ceiling tile installation were both collected to examine areas with differing levels of technological intensity. In order to include residential construction, 2 x 4 stud wall framing was chosen. Open web joist assembly, performed by a number of trades, represented commercial construction.
Generalized data on output for construction tasks and their costs have been available for several decades through cost-estimation manuals. Such manuals are not intended for productivity studies, but they provide one of the best sources for time-series data on productivity that is publicly available. Means Building Construction Cost Data, the particular manual selected, is a standard industry reference used in cost estimation. Using this type of data source provided consistency in data collection and simplified output comparisons across tasks.
The Consumer Price Index was then used as the deflator in converting cost figures into real terms, with 1990$ used as the reference. 1 Often in adjusting construction prices, the cost indices published by Engineering News Record are used. However, the CPI provides the more universal constant value figure desired, as opposed to a narrow, industry specific, conversion factor.
In order to compare the productivity trends examined in the Means estimation manual, data relating to direct work rates from 72 projects in Austin, Texas over the last 25 years of work sampling studies were also examined. The direct work rate is a percentage of time on productive actions such as erecting formwork, tying reinforcing steel, and placing concrete. Other work activities, like transporting materials and tools or getting instructions are considered support time. Finally, when the workforce may be waiting or taking a break, this is considered idle time. Direct work rates are a measure of efficiency in terms of time, therefore increasing the direct work rate usually increases construction productivity.
1 Some feel the CPI overstates inflation, and some also feel that wages reflect a more pro-cylical pattern if the CPI is used as opposed to other inflation deflators (Abraham 1995).
Defining productivity is not a simple task. Marketable output was essentially the main measure used for analysis within this report. Focusing on such a simple indicator given the complexity of the modern economy can be dangerous. Under normal economic circumstances, an expansion of the economy must be accompanied by a proportional rise in productivity, or inflation will inevitably set in. However, over the past seven years the US economy has grown at a robust rate of approximately 2.5% while inflation has remained in check. Many economists, including Federal Reserve Board chairman Alan Greenspan, reject the accuracy of such a productivity index claiming that the math leaves no other choice (Uchitelle, 1997).
The remainder of this report is focused on the compilation and analysis of the productivity data related to the construction activities described earlier. First, however, factors affecting productivity are reviewed. It is the myriad of factors that exercise influence over construction productivity that create the difficult nature of the problem.
Projects in construction are never designed or built exactly in the same manner as previous projects. Environmental factors such as the landscape, weather and physical location force every project to be unique from its predecessors. There are also aesthetic factors that create uniqueness from project to project. Such factors have a significant impact upon major project characteristics. While most construction personnel find this uniqueness to be an attractive element for a career in construction, it can have an adverse effect upon construction productivity. Project uniqueness requires modifications in the construction processes. These modifications require workers to go through a learning curve at the beginning stages of each project activity.
Technology has had a tremendous effect on overall productivity. All but the most basic of tasks on a site have seen changes due to advances in technology over recent years. Tools and machinery have increased both in power and complexity. These advances in technology can significantly modify skill requirements. This can create difficulties in separating the contributions of technology, management, and labor to productivity.
Introducing new technology can be more difficult in the construction industry than in other industries. Innovation barriers such as diverse standards, industry fragmentation, business cycles, risk aversion, and other factors can create an inhospitable climate for innovations. In many regions of the country, labor costs for many skills are relatively low. There is less motivation to automate a task when the labor associated with the task is not expensive.
Due to such impediments, firms are naturally reluctant to try a new technology, especially if it amounts to putting the entire company on the line. Should the new technology prove effective, the firm gains only a temporary strategic advantage. Once it is proven, other bidders can quickly begin to adopt the technology. Gestation periods can vary widely depending on the market force behind the innovation and other factors. This cycle is typical, and is one reason for the step change nature of construction productivity for individual activities or tasks when technology is the main factor.
Management complicates progress in productivity within the construction industry. Past studies found that poor management was responsible for over half of the time wasted on a job site (Business Round Table, 1983). Good management is required for profitability and success.
Cross-training and multiskilling can reduce unit labor costs (Burleson, 1997). Contracts that create flexible work rules on the job site promise productivity benefits as well. Barriers between trades have historically been a source of problems in construction. Reduction in the percent of the workforce comprised of organized labor and improved project agreements with remaining construction labor organizations have reduced this problem.
Real wages have fallen in the construction industry at a more rapid pace over the past 30 years than have wages for most American workers. An increasing percentage of open and merit shop work partially drove this downward trend. It is estimated that union labor declined from approximately 70% of the construction work force in the 1970s to 20% in the 1990s. Wages in real terms were driven down as shown in Figure 2.1 (Slater, 1997). Additionally, total compensation rates may compare with other industries even
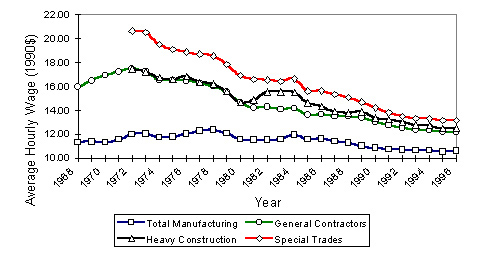
less favorably than wage rates suggest, since construction industry work is often sporadic, while transportation and moving costs are higher. Older craftsworkers have retired, and younger entrants to the labor pool increasingly choose career paths other than construction, creating a skilled labor shortage which is plaguing the industry (Business Round Table, 1998). This trend has been compounded by the tendency of workers in the construction industry to retire at an earlier age than those in other industries (CPWR, 1997). Not only is construction drawing a lower proportion of potential workers, but the total size of the potential worker pool also shrank during the early 1990s due to a decreasing number of 18 to 24 year olds entering the job market (Emerick, 1989).
There is currently a lack of formal training in construction-- the lowest of any major sector of the economy (CPWR, 1997). This lack of training is due to practical concerns such as employers completing the increased percentage of nonunion work. In general, the workforce of contractors is highly mobile. For this reason, contractors are often reticent to invest capital to train those who may soon be someone else's employees. The result may be a decrease in the construction workforce average capability level. It is unclear how this affects productivity. More effective utilization of large narrow-skilled and core multiskilled workforce's may even result in higher productivity on some projects.
As noted, Means cost manuals were used to provide the data to analyze productivity trends in the US construction industry over the past 25-30 years. Labor and output productivity were tracked for residential framing, commercial web joist construction, compaction, hand-trenching, welded steel pipe installation, and ceiling tile installation. These activities were chosen to sample a wide array of technology intensities. The wages are adjusted for inflation using the Consumer Price Index.
3.1.1 Framing Productivity in Housing Construction
Housing construction comprises a significant portion of overall construction activity. In 1994, 63% of all private sector construction by value consisted of residential construction (Anderson, 1994). Productivity in this area has profound effects on not only the industry, but on society at large. Increased productivity could lead to more affordable housing.
Different subcontractors must perform the carpentry, masonry, electrical, mechanical, and earthwork processes to name only a few. The market share of prefabricated joists, roof trusses, and other subsystems, as well as manufactured housing is growing. This likely has a positive impact on housing productivity; however, the industry is still largely dominated by small independent contractors. Such fragmentation is partly due to the regulatory situation. For housing construction, codes differ throughout the United States, creating additional roadblocks to standardization that could potentially increase productivity (Anderson, 1994).
Framing costs were examined over the past 30 years as an indicator of productivity within residential construction. Framing is considered to have medium to low technological intensity. While it is only one of many operations carried out in the construction of a residence, framing constitutes an important task similar to several others performed by carpenters -- a trade in which productivity affects many different stages of the construction process. The average house requires only 1,500 to 2,500 linear feet of lumber for outside framing walls (Walker, 1995). This is roughly equivalent to between 1 and 1.6 MFBM2, meaning that such an operation could be completed within the span of only a few days for the average house at the productivity rates contained in Means.
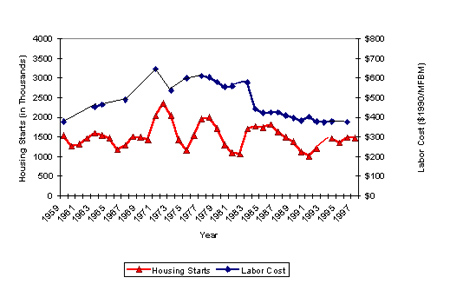
It is important initially to note the interaction between the cost of framing labor and the business cycle, as can be seen in Figure 3.1 (Darnay, 1994). Even though housing starts may decrease during recessions, the real cost of framing labor has a general tendency to increase during these periods. During recessions, the companies can no longer afford to keep all their employees and the most skilled laborers are those they keep. These most skilled members of the work force also generally constitute the most highly paid.
2 One Foot Board Measure (FBM) is equivalent to the volume of one square foot of lumber one inch thick, or 1/112 a cubic foot of lumber. One MFBM equals one thousand FBM.
If it is true that the workforce is more efficient during such recessions, then this points to a typical discrepancy in the Means data (Figure 3.2), since efficiency appears to be constant throughout. This chart demonstrates graphically both the accuracy of Means as a real-time indicator of labor costs and one of the ways in which it is inadequate as a real-time indicator of output. The workforce consists of only the most productive workers during recessions and absorbs less productive workers during expansions, yet the output appears to have remained constant across these cycles. As the composition of the workforce changes, estimators alter how they interpret the benchmark values. This indicates how subjective, and unpredictable, construction estimation can be.
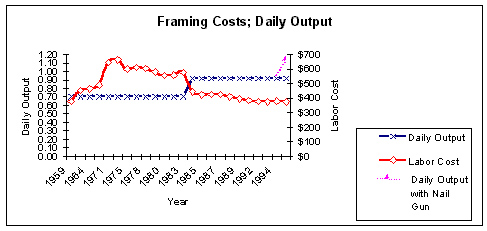
Examination of framing labor output, as shown in Figure 3.2, reveals an interesting trend as well. The assumed output remained constant from 1960-1983, at which point in time the labor productivity numbers reflected an increase of 0.22 MFBM/day. This constituted a 31% productivity increase. Clearly, this is an adjustment, and it may reflect an underlying trend. The overall economy in 1985 had exhibited a 32% output gain since 1966.
Technology may have played a partial role in this particular increase. As tracked, the task had always used power tools but at no point explicitly included the use of pneumatic nail guns. The use of such tools was introduced into practice in the 1980s. Only in 1996 was the use of pneumatic nail guns separated out as a distinct method with significantly higher productivity associated with it. This is an example of a productivity jump to 1.1 MFBM/day that is more likely due to technological advances in equipment.
As can be seen, no major equipment cost increase preceded the output jump, as might be expected if the equipment were the causal factor in the productivity change. Note that equipment costs given are per day, not per unit output. Had output been increased by the use of more expensive equipment, the expense would be reflected even if equipment costs per unit decreased.
3.1.2 Web Joist Productivity in Commercial Construction
Commercial construction makes up a large share of total construction as well, although this share varies. At one time in the 1980s commercial construction accounted for over 19% of all construction spending in the United States (Anderson, 1994). Since then, and partially due to the high amount of spending in this area during the 1980s, the proportion of construction money spent in this area has fallen considerably. Web joist cost data was chosen to examine this area due to the use of structural steel in much of commercial construction. Web joist installation is considered to have medium technological intensity.
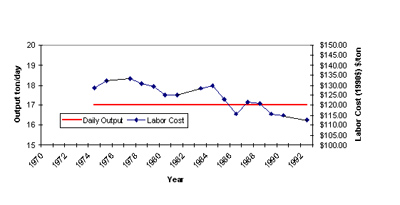
The labor cost trends of web joist installation, as they appear in Figure 3.3, follow generally the same trend as those for framing, reflecting the overall decrease in construction industry wages. The increase during the mid-70s reveals a generally accepted period of decreasing construction productivity. The high inflation of the late 1970s may have contributed to the drop in real wages during the latter part of the decade.
Output data for web joist assembly does not reflect the positive trend that framing cost data revealed. Output remained assessed at a constant 17 tons/day throughout the 30 years for which data was available. Reasons for this could be many.
Besides cost trends and output trends, the web joist task also demonstrated a personnel trend. Means crew E-7 performed this particular task. In 1975 the crew included two light equipment operators in addition to the crane operator. By 1980, one of these light equipment operators had been removed, leaving only one light equipment operator for crane maintenance. However, the number of crew members remained constant due to the addition of a welder foreman to the crew during the same time period. In 1975 two welders had been included on the crew with no supervision included. Yet, as was shown in Figure 3.3, the wage rates for the overall crew continued to decline steadily over this time period.
3.1.3 Compaction Productivity in Heavy Construction
Regardless of the
type of construction performed, the site will require alteration as preparation
for the construction. One part of this preparation is compaction of the
soil. Compaction is considered to be a high technological intensity task.
Means crew B-10G, comprised of one heavy equipment operator, performs
this task. Compaction using a sheepsfoot roller with 8" lifts was therefore
traced over the past 22 years.
Compaction exhibited a 260% increase in productivity during the mid-1980s,
as shown in Figure 3.4. The addition of vibration
to the rolling action of the compactors
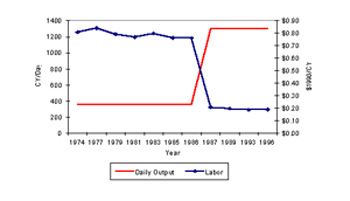
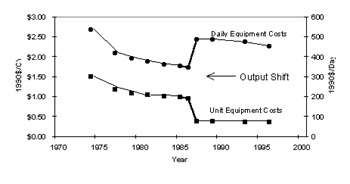
Although the equipment
change led to a 40% increase in daily equipment costs, as shown in Figure
3.5, it also led to a 60% decrease in unit equipment costs. This demonstrates
both the dramatic increase in capital costs when employing new equipment
and the high potential such equipment has to improve production and to
decrease unit costs in the long run. Such capital investment increases
can prohibit the entry of new equipment into the industry while it remains
unproven, but the tremendous decrease in costs explains the willingness
of some to take risks on new equipment.
In contrast to the effect of technology reflected in sheepsfoot roller compaction, the hand trenching performed during the site-preparation phase involves minimal technology. (The last technological progress in this area seems to have been the invention of the metal spade.) No change in output was expected for such a task, and none was observed. However, the trends in wages of the common laborer -- the entry-level position for much of construction -- were revealed, as reflected in Figure 3.6.
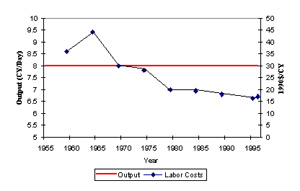
By 1996, common laborers in the construction industry had experienced a 40% reduction in their real wages since 1970. In contrast, over the same period, total manufacturing wages in real terms fell only 6%. This fall in wages at common laborer and entry-level positions has hurt construction in attracting new entrants.
Examining productivity and wage trends for the installation of welded steel pipe broadened the focus to include the plumbing trade. Means crew Q-16, composed of two plumbers, performed this task. One 400A welding machine was also used for this task throughout the period under consideration. This particular welding task is determined to have medium technological intensity.
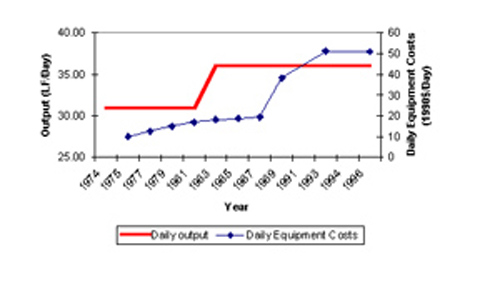
As shown in Figure 3.7, unit labor costs fell steadily for this task just as they had for other tasks. From 1974 to 1996, daily wages for plumbers fell 9%, roughly equal to that of equipment operators such as those involved in the compaction task, but considerably less than the fall in wages of the common laborer. The data reflected a 16% increase in output during the early 1980s, from 31 LF/day to 36 LF/day.
Measurement of this
task is somewhat problematic from at least one perspective. In the last
decade, there has been a marked increase in prefabricated spools, welded
in the shop, using automated orbital welding machines. It might be more
accurate to aggregate the productivity and output measures for the pipe
that is eventually put in place for a particular facility. This may be
especially true for industrial construction, however for the purposes
of this study, it is adequate and appropriate to limit the scope to field
welding.
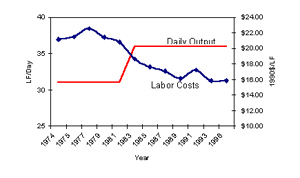
No change in daily equipment costs coincided with the output change in the welded steel pipe task as shown in Figure 3.8. This would seem to indicate that no change in the equipment type used caused this change in output. Conversely, an increase in daily equipment costs occurred in the late 1980s without resulting in any type of output increase. Either equipment costs and output are not related, in this case, or Means delayed adjustment of its equipment costs for six years.
Figure
3.8: Historical Trends in Welded Steel Pipe Output and Daily Equipment
Costs
Acoustic ceiling tile data was gathered due to the role of technology change in this task (the introduction of rotating laser levels) and to gain a different perspective on the carpentry trade already examined in framing. Since this task also is performed by the carpentry trade, it shows wage trends similar to those seen in framing. The only difference is that very slight economies of scale may have been gained in the two-member framing crew when compared to the one carpenter ceiling tile crew.
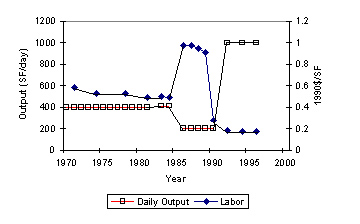
The data on acoustic ceiling tiles reflected a task where output exhibited a trend very different from the static nature of construction productivity. In the time period since 1971, the output benchmark for this task has been adjusted three times, as can be seen in Figure 3.9. Of the tasks considered, this is the only one to exhibit a drop in output at anypoint in time. In the early 1980s, output was adjusted down approximately 50% from 410 SF/day to 200 SF/day. Towards the end of the decade, output was adjusted upward on the order of 500%. It is possible that the introduction of the use of lasers as an aid in performing this task ultimately improved productivity over time. It would be interesting to investigate whether the radical adjustments were due to errors and corrections, or if they reflect other factors such as learning and training delays.
Results from these case studies are analyzed later, along with work sampling data presented in the next section.
Work sampling is a system for indirectly measuring productivity on construction sites, which has been used for more than 30 years. Work sampling measures how time is utilized by the labor force (Thomas, 1984). The analysis of work sampling data is the same as measuring how the time is utilized by the workers on a job site and thus gives insight into their productivity rates. Analyzing work sampling data collected over a period of time can suggest trends in productivity rates during that period. A study conducted at The University of Texas at Austin examined work sampling data collected from 72 typical construction projects in the Austin, Texas area over a 25 year period.
In the work sampling technique, observations of what each worker is doing at a particular instant are made and recorded. The activities of workers are typically divided into three categories: Direct Work, Supportive Work, and Delay. Although the definition of each category can be dependent upon the craftsman performing the work, the type of work, and viewpoint of the observers, it is very important to set a clear definition of the categories for reliable data collection to take place (Business Roundtable, 1982). Typical definitions of the three categories are the following: 1) Direct work includes productive actions, picking up tools at the area where the work is taking place, measurement on the area where the work is taking place, holding materials in place, inspecting for proper fit, putting on safety equipment, and all cleanup; 2) Supportive work includes supervision, planning or instruction, all travel, carrying or handling materials or tools, and walking empty-handed to get materials or tools; 3) Delay includes waiting for another trade to finish work, standing, sitting or any non-action, personal time, and late starts or early quits.
Work sampling gives information about time spent on activities and therefore gives indirect information about productivity. However, direct work time does not necessarily correlate with unit rate productivity. In other words, a high percentage of direct work time would not always indicate an equally high level of unit rate productivity because of variation in skill levels of the workers sampled, work methods, and types of tools and equipment used. For example, a skilled worker may produce more than an unskilled worker performing the same task even though both have the same direct work rate. A carpenter utilizing a skill saw will out-produce a carpenter with a handsaw even though the direct work percentage may be the same. Even considering these constraints, work sampling can be useful as a diagnostic tool for productivity improvement programs (Business Round Table, 1982).
The direct work rate is a percentage of the time spent on direct work in all working hours. In other words, direct work rate determines the efficiency of workers in terms of time. Therefore, it is clear that increasing the direct work rate usually increases construction productivity.
Figure 3.10 represents the chronological development of the direct work values for the previously mentioned 72 projects. The annual direct work mean values of the projects varies from 41% to 61%. This result is in line with a previous prediction that states that direct work values fall within 40% to 60% in most construction projects (Oglesby, Parker, and Howell, 1989). Note that data was not collected every year after 1985.
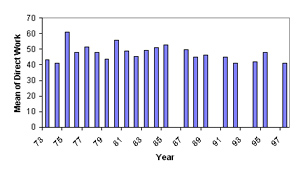
Figure 3.10 indicates that direct work values have not been affected over the last two decades in the Austin area. Austin is typical of other building markets in the US. Reasons to explain the stagnation may be that the characteristics of the labor force have not changed significantly over the last two decades, and management and supervisory effectiveness has not improved over the same time period. This coincides with the findings in the previous case studies. In the activities where there had been substantial technological improvement, such as compaction, it is clear that there has been an obvious increase in output. However, in activities that have not been affected by technology improvement, such as hand trenching, the output has remained constant. This reflects a broad historical trend in advanced countries. While opportunities exist on every project to improve management, historically technology has been the main driver behind productivity increases.
The method presented for studying broad productivity trends included measuring unit labor costs, output, and direct work rates. It also involved the investigation of underlying technological shifts and socioeconomic trends. While such a combination of case studies can lay the foundation for more thorough subsequent statistical analysis, it does not comprehensively deal with productivity within the construction industry. It may be that productivity for other tasks or within different trades has exhibited different trends. However, some preliminary results may be observed.
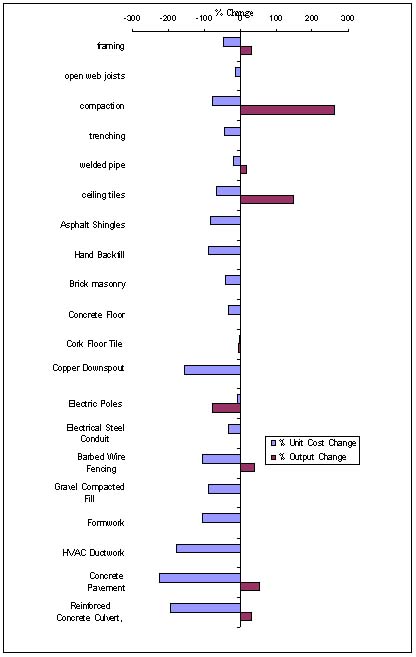
The data shows that productivity has increased for all tasks studied in this report. Not all tasks increased output, though the majority did so, but all tasks reflected a decreasing unit labor cost in real terms, as shown in Figure 4.1. Both of these trends reflect an increase in productivity. Tasks such as trenching and joist installation where the output has remained constant demonstrate the extent of the fall in wages of unskilled labor. Data was also collected for 14 additional tasks as shown in Figure 4.1. Once again, these additional tasks were selected based on diversity in technical intensity and diversity in trade and sector. All of these tasks showed an increase in productivity as well, except for electric poles (installation) and cork tiles, which both showed a decrease in output although they showed a decrease in unit cost as well. The reasons for these and other peculiarities could be studied with further research. Alternatively, by examining direct work data, it is evident that there is still room for improvement through field management practices such as detailed preplanning, even in cases that have no option for technology improvement.
4.2 Productivity Case Studies Indicate an Overall Upward Trend
Over the entire span of the past 25 years no overall decrease in productivity was found. If productivity has decreased, no evidence for it exists in these tasks. In fact, some tasks demonstrated dramatic productivity increases, such as the 500% increase for ceiling tile installation during the early 1990s and the 260% increase in compaction.
However, all productivity increases cited here occurred following 1980. It appears that overall productivity may have decreased during the 1970s but recovered in the 1980s. Many of these productivity increases appear to be due to technology, although the increases in welded pipe installation and framing possibly involved labor skill productivity increases.
4.3 Study Agreement with Broader Indicators
While limited, some other data exists describing the overall productivity in the construction industry. Figure 4.2 (Bernard, 1996) shows total factor productivity (TFP), a weighted average of the contributions of labor and capital to productivity, within the construction industry for the time period 1970-1987 based on unpublished Bureau of Labor Statistics Data. Following 1981, total factor productivity ceased its downward trend and resumed the climb it had exhibited in the early post-WWII period. A change at this point in time agrees with the data gathered from Means. None of the output improvements noted occurred prior to 1981, but were spread out after this point in time. If the correspondence between contractor wages and log(TFP) holds, productivity would seem to have increased since 1981.
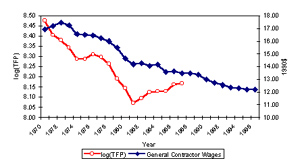
Measuring productivity by using total factor productivity is problematic however. Based on this measure, not only did construction productivity fall at an average annual rate of 5.1% from 1967-1973 -- compared to an average rate of 1.1% decline from 1974-1985 in the economy as a whole -- but productivity within the financial and services sectors of the economy showed no growth during the postwar period. None of these indications of productivity change seem to coincide with reality (Griliches, 1988). It seems much of the problem in explaining trends in productivity is the lack of an adequate productivity measure.
4.4 Wage Adjustment Issues and Problems Using Economic Time Series Data
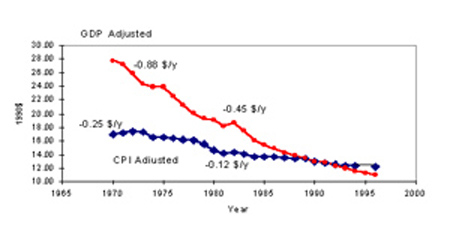
The CPI was used as a wage deflator due to its adherence to industry standards. Many question the validity of this particular measure as an inflation deflator. Some economists assert that constant productivity is an underlying assumption for use of any cost index, which complicates matters even more for studies such as this one (Pieper, 1989). One alternative is to use the national annual GDP as a deflator. A comparison of results yielded by using this indicator when compared to using the CPI for the hand-trenching task -- which exhibited the greatest change in wages of all the tasks examined -- appears in Figure 4.3. Although the fall in real wages was great using the CPI, it is even more pronounced when using the GDP. Which deflator is chosen makes a 30% difference in the apparent real wage change. This difference emphasizes the great difficulty in comparing economic series across time.
4.5 Recommended Further Research
This analysis of productivity trends should serve as a predecessor for extensive statistical studies. This study collected 50 to 60 data points from Means catalogs for each case study. The results of these analyses produced significant results for the examined tasks. A good follow-up to this study would be to use the same methodology but expand it to a wide array of construction activities, say 300 activities distributed over construction sectors and degrees of technological intensity. By collecting a reduced number of data points, approximately 10-15, for each activity, a broader and more statistically significant picture of the overall productivity trends for the US construction industry could be obtained. The larger sample size would also allow a greater statistically significant correlation to be investigated between technology change, depressed real wages, and productivity improvement.
The method of examining construction productivity presented here provides a starting point for more focused and statistically robust studies in the future. It suggests many avenues of future investigations such as the impact of technology on construction productivity. A few preliminary observations may also be made. Productivity has increased substantially in construction in the last two decades. The two biggest reasons for the increase are depressed real wages and technological advances. Based on the data used in this study, management practices were not a leading contributor to construction productivity changes over time. More thorough statistical information are required to confirm this point.
The industry needs to expand benchmarking efforts such as those being pursued by the Construction Industry Institute (CII) and Associated Building Contractors (ABC). Additional research is needed to conclusively determine productivity trends. Part of the problem at this time is the availability of data. The reluctance of the Bureau of Labor Statistics to publish information on productivity due to a lack of reliability demonstrates this difficulty. The Means manuals provide an indication of productivity trends, but any detailed analysis is difficult due to the crude nature of the source. Additional detailed data would provide the opportunity for more research to understand the relative contribution of the controlling factors.
Allen, Stephen G. (1985), "Why Construction Industry Productivity is Declining." The Review of Economics and Statistics. The MIT Press, 117(4), 661-665.
Anderson, Rolf, Editor (1994). Atlas of the American Economy: An Illustrated Guide to Industries and Trends. Congressional Quarterly, Washington, D.C.
Barry, Susan, Editor (1998). U.S. Industry and Trade Outlook '98. DRI/McGraw Hill, New York, NY.
Bernard, Andrew B. and Jones, Charles I. (1996), "Productivity across Industries and Countries: Time Series Theory and Evidence." The Review of Economics and Statistics. The MIT Press, 128(1), 135-141.
Building Construction Cost Data. 18th-55th editions (1960-1997). RS Means Co., Kingston, MA.
Bureau of Labor Statistics (1998).General Website. 1998. http://stats.bls.gov. 11/4/98.
Burleson, Rebecca C. (1997). "An Analysis of Multiskilled Labor Strategies in Construction." Dissertation. Department of Civil Engineering. The University of Texas at Austin, Austin, TX.
Business Roundtable. (1988). CICE. The Next Five Years and Beyond. Business Roundtable, New York, NY.
Business Roundtable (1997). Confronting the Skilled Construction Work Force Shortage. Business Roundtable, New York, NY.
Business Roundtable. (1982). Construction Productivity Measurement. Report No. A-1, Appendix B-3, Business Roundtable, New York, NY.
Business Roundtable. (1983). More Construction for the Money. Business Roundtable. New York, NY.
Caterpillar Performance Handbook (1990). Caterpillar, Inc., Peoria, IL.
Chen, W.F. Editor (1995). The Civil Engineering Handbook. CRC Press, Boca Raton, FL.
The Construction Chart Book: The US Construction Industry and Its Workers (1997). CPWR – Center for Construction Research and Training. Washington, DC
Construction Procurement Handbook For School Districts and Institutes of Higher Education (1997). Associated General Contractors (AGC) - Texas Building Branch. Austin, TX.
Darnay, Arsen, Editor (1994). Economic Indicators Handbook, 2nd Ed. Gale Research Inc. Detroit, MI.
Eisner, Robert (1994). The Misunderstood Economy. Harvard Business School Press. Boston, MA.
Emerik, Paul (1989). "Countering Labor shortages in Construction" Vocational Education Journal. American Vocational Association, 64(7), 22-23.
"First Quarterly Cost Report" (1998). Engineering News Record, McGraw-Hill Companies. New York, NY.
Griliches, Zvi (1988). " Productivity Puzzles and R & D: Another Nonexplanation." The Journal of Economic Perspectives. American Economic Association, 2(4), 9-21.
Jablonski, Mary. (1998). "Re: Construction Industry Productivity." Electronic Correspondence, 16 Mar. 1998.
Lasby, Clarence (1997). "United States Since 1941." Course Offering, The University of Texas at Austin, Austin, TX.
Oglesby, C.H., Parker, H.W., and Howell, G.A. Productivity Improvement in Construction. New York: McGraw-Hill Book Company, 1989. pp.87, 152, 175.
Pieper, Paul (1989). "Why Construction Labor Productivity is Declining: Comment." The Review of Economics and Statistics. The MIT Press, 71(3), 543-546.
Polivchak, Philip. (1989). "Construction Trends Dictate Vital Skills." Vocational Education Journal. American Vocational Association, 64(7), 21-23.
Sanvido, Victor E. (1988). "Conceptual Construction Process Model." Journal of Construction Engineering and Management, Vol. 114(2), 294-311.
Slater, Courtenay M., Editor (1997). Business Statistics of the United States. Berna Press. Lanham, MD.
Slaughter, E. (1993) "Builders as Sources of Construction Innovation". Journal of Construction Engineering and Management, ASCE, 119(3), 532-549.
Sweet, Justin (1994). Legal Aspects of Architecture, Engineering and the Construction Process. 5th ed., West Publishing Co. St. Paul, MN.
Tatum, C.B. (1986). "Potential Mechanisms for Construction Innovation." Journal of Construction Engineering and Management, ASCE, 112(2), 178-187.
Thomas, H. R., Guevara, J. M., and Gustenhoven, C. T., "Improving Productivity Estimates by Work Sampling," Journal of the Construction Division, ASCE, June 1984. pp. 178-188.
Tietenberg, Tom. (1998). Environmental Economics and Policy. 2nd Ed., Addison Wesley. Reading, MA.
Uchitelle, Louis. "Greenspan's Limited Faith in the Nation's Economy." (1997). New York Times, New York, NY.
Walker's Building Estimator's Reference Book, 25th Edition. (1995) Siddens, Scott Editor. Frank R. Walker Co., Lisle, IL.
Point of Contact
Heather Wesling
The University of Texas at Austin
College of Engineering
Center for Construction INdustry Studies
ECJ 5.202
Austin, TX 78712-1076
Fax: (512) 471-3191


