
The Effects of Debris Accumulation Upon Air Flow and Filter Resistance to Air Flow for Four Commercially Available Vacuum Cleaners
Summary Statement
The results of a laboratory study conducted to evaluate how mortar debris affects air flow and pressure losses through a vacuum cleaner’s filters.
May 2008
May 2008
Prepared for
Center to Protect Workers Rights
Department of Occupational and Environmental Health
College of Public Health
The University of Iowa
Iowa City Iowa 52241
ABSTRACT
In order to adequately control dust exposures during mortar removal, vacuum cleaners need to exhaust 80 cfm from an exhaust hood on the grinder and maintain this air flow while collecting as much as 35 pounds of debris in the vacuum cleaner. A laboratory study was conducted to evaluate how mortar debris affects air flow and pressure losses through a vacuum cleaner’s filters. Four vacuum cleaners were tested. Two of the vacuum cleaners used vacuum cleaner bags as a prefilter while the other two vacuum cleaners used cyclones to reduce the amount of debris which hits the filter. To conduct the testing, a contractor provided mortar removal debris that had been collected during actual mortar using grinder hood and a vacuum cleaner which involved cyclonic pre-separation. The vacuum cleaner fan curves were obtained experimentally to learn how pressure loss affects vacuum cleaner air flows. Then, 35 pounds of mortar removal debris was sucked into the vacuum cleaner in 5 pound increments. Before and after adding each five pound increment of debris, vacuum cleaner air flows were measured with a venturi meter and vacuum cleaner static pressures were measured at the inlet to the vacuum cleaner motor, before each filter and after each filter. The vacuum cleaners equipped with cyclonic pre-separation were unaffected by the mass of debris collected in the vacuum cleaner. These vacuum cleaners were able to maintain air flows in excess of 70 cfm throughout the testing program. As debris accumulated in the vacuum cleaners that used vacuum cleaner bags, air flow decreased from 80 cfm to as little as 30 cfm. This air flow loss is caused by the increased air flow resistance of the vacuum cleaner bags which increased from less than 0.1 inches of water per cfm to 2 inches of water/cfm which is 60 inches of water at an airflow of 30 cfm. Apparently, vacuum cleaners using vacuum cleaner bags should be used in applications where adequate dust control can be achieved at air flows less than 30 cfm. Where higher air flows are needed, vacuum cleaners should incorporate cyclonic pre-separation in an effort to prevent debris from reaching the vacuum cleaner final filters.
INTRODUCTION
During construction and renovation tasks, the cutting and grinding of concrete and masonry material can cause excessive exposure to respirable crystalline silica.1 More than 35,000 nonresidential construction workers in the United States are exposed to more than twice the National Institute for Occupational Safety and Health (NIOSH) Recommended Exposure Limit (REL) for crystalline silica.2,3 This exposure limit is 0.05 mg/m3 for respirable crystalline silica.4 The use of right angle grinders to remove deteriorated mortar from buildings causes a particularly excessive exposure to respirable crystalline silica. During mortar removal, occupational exposures to respirable crystalline silica are reportedly as high as 5 mg/m3. Other construction and renovation tasks such as concrete grinding, concrete drilling, brick cutting, cutting roofing tile are also reported to cause excessive exposure to crystalline silica.1 The ACGIH TLV for respirable crystalline silica is an 8-hour time weighted average of 0.025 mg/m3 of respirable crystalline silica is intended to prevent pulmonary fibrosis (silicosis) and lung cancer.5,6 In summarizing the findings from the literature, ACGIH noted that , “when retirees whose workplace silica-exposure concentrations averaged 0.06 mg/m3 were studied, the risk of silicosis was significantly greater (7.1% versus 1.2%) when compared to employees examined at or before retirement.”7 Thus, ACGIH recommends that worker exposures should be kept below 0.025 mg/m3 so that workers will not have silicosis at retirement.6 Thus, effective control measures are needed to reduce worker exposure to crystalline silica.
Figure 1. A vacuum cleaner exhausts air from a hood mounted on a grinder used for mortar removal.
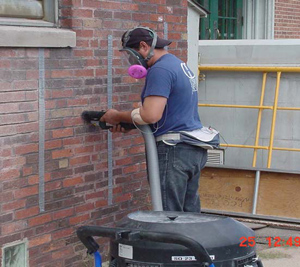
To remove deteriorated mortar, workers use hand-held, right angle grinders equipped with a 4.5 inch (11 cm) grinding wheel rotating at 10,000-12,000 rotations per minute (rpm) to pulverize the deteriorated mortar which contains crystalline silica. While operating the right angle grinder, the worker applies pressure to the grinding wheel to maintain a cut depth of 0.39-0.79 inch (1-2 cm). To capture the dust, a vacuum cleaner can be used to exhaust a minimum of 80 cubic feet per minute (cfm) (2.26 m3/min) from a hood that is mounted on the grinder as shown in Figure 1.8 When airflows fall below 76 ft3/min in a 2 inch hose, the air velocity in the hose will be less than the 3500 ft/min (fpm) specified to prevent debris from accumulating in ventilated ducts and plugging them.9 This finding was based upon laboratory and computational studies. During field trials, respirable crystalline silica exposures for 22 samples had a geometric mean of 0.06 mg/m3 and a range of less than 0.01 to 0.86 mg/m3.10 In other studies, geometric mean respirable crystalline silica exposures during mortar removal were reported to be between 0.35 and 1.1 mg/m3. 1, 8, 11 The use of local exhaust ventilation (LEV) during tuck point grinding dramatically decreases personal dust exposure levels about 5-20 times less than tuck point grinding conducted without any engineering control.10 Therefore, grinders with LEV should be used in order to control exposure to respirable crystalline silica.
During field trials, vacuum cleaners flow rates decreased as debris accumulated in the vacuum cleaner.10 The vacuum cleaner air flows showed a periodic fluctuation (Figure 2) as vacuum cleaner filters were treated to dislodge debris that had caked onto filters.10 As summarized in Table 1, actual cleaner air flow rates had an average initial flow rate between 104 and 70 cfm. However, the average flow rate decrease was between 3 to 0.4 cfm/minute over a range of vacuum cleaners and hose diameters.10 At a flow rate loss of 3 cfm/min, vacuum cleaner air flows can be negligible after a period of only 30 minutes.
In Table 1, a vacuum cleaner used with a cyclone, the DustControl 2700, had a more stable airflow than the other vacuum cleaners. Cyclones are sometimes used as pre-separators that collect debris upstream of filters. In a cyclone, larger size particles are separated from the air stream by impaction on the cyclone’s wall. This cyclonic pre-separator for The DustControl vacuum cleaner has a pressure loss of 6 inches of water at 85 ft3/min which reduces the initial airflow by about 9 ft3/min.10,12 However, the cyclones may reduce the amount of debris that accumulates on the vacuum cleaners’ filter in order to maintain adequate airflow.
Vacuum cleaner air flows were obtained by measuring vacuum cleaner static pressure, the pressure in the space between the final filter and the inlet to the vacuum cleaner motor.10 An experimentally determined fan was used to convert vacuum cleaner static pressure to air flow. Vacuum cleaner fan curves, relation between vacuum cleaner static pressure and air flow, are stated mathematically as:12
Q = m (ΔPv-sp) + b (1)
Where;
Q = the air flow (cfm),
ΔPv-sp = the static pressure at the vacuum cleaner motor inlet (inches of water), andm, b = regression coefficients for, respectively, the slope and intercept.
The R2 values, the fraction of the variability explained by the vacuum cleaners’ fan curve, was better than 0.98.10 The intercept (b) is the air flow with no pressure loss and this airflow is sometimes called “the free air flow”. The slope (m) is always less than zero as flow rate decreases with increasing static pressure. The slope has these dimensions: cfm/inch of water. The flow rate loss attributed to the debris accumulation on the filters is the product of the slope multiplied by the increased pressure loss due to accumulation of debris on the vacuum cleaners’ filters.
Increased filter pressure losses probably explain the loss of air flow that occurs with increased debris accumulation. Generally, air flow through a filter is proportional to the pressure loss across a filter. This proportionality constant should be independent of air velocity or air flow.12,13, 14 For each filtration element, this proportionality constant (Kfilter) is stated as:
Kfilter = ΔPfilter / Q (2)
Where; ΔPfilter = pressure loss across a filter ; and
Q = vacuum cleaner air flow.
This model assumes laminar flow through the filters. As presented latter, the filter area for the final filters in the vacuum cleaner were between 0.4 and 2.1 m2. At 80 cfm, the filter face velocities are between 18 and 0.8 fpm. Such low velocities are consistent with laminar flow. In this work, this proportionality constant (Kfilter) is termed “filter resistance.” As vacuum cleaners accumulate debris, air flow rates decreases (Table 1). The filter resistance is means to normalize data for decreases in flow rate caused by increased filter loading.
| Table 1. Summary statistics describing flow rate and flow rate loss during mortar removal | |||||
Vacuum Cleaner |
Hose Diameter (inches) |
Average initial flow (cfm) |
Geometric standard deviation |
Average Flow rate loss (CFM/minute of grinding) |
Geometric Standard Deviation |
Shop Vac QUL650 |
2 |
104.79 |
1.21 |
3 |
1.81 |
Dust Director 9.5 |
1.5 |
84.78 |
1.11 |
2.01 |
1.47 |
Bosch 3931 |
2 |
79.28 |
1.08 |
1.17 |
1.72 |
Dust Director 9.5 |
2 |
88.68 |
1.21 |
1.16 |
1.48 |
Alto Wap SQ23 |
2 |
128.95 |
1.2 |
0.97 |
2.32 |
DustControl 2700 |
1.5 |
70.95 |
1.23 |
0.66 |
1.27 |
DustControl 2700 (with/ cyclonic pre-separator) |
2 |
90.21 |
1.04 |
0.41 |
1.39 |
Figure 2. Exhaust airflow through Dust Director vacuum cleaner operated with 12 feet or 1.5 inch diameter corrugated hose.
OBJECTIVE
Clearly, the amount of debris accumulating in vacuum cleaners reduces the air flow needed to control the dangerous exposures caused by mortar removal. This reduced air flow can potentially increase the emissions of respirable crystalline silica into the worker’s breathing zone. Thus this research was conducted to evaluate how debris accumulation within the vacuum cleaner affects vacuum cleaner flow rate and pressure loss through the vacuum cleaner filters. The flow rate loss due to debris accumulation is simply the product of the pressure loss across a filter (δPf) and the slope of the vacuum cleaner fan curve (m).
MATERIALS AND METHODS
This testing was conducted to assess how the mass of material collected in four vacuum cleaners affects vacuum cleaner air flow and filter pressure losses. These vacuum cleaners have different characteristics that are listed in Table 2, and those characteristics influence the pressure loss across the various vacuum cleaner filters and the vacuum cleaner air flow.
Vacuum cleaners
The vacuum cleaners listed in Table 2 are all commercially available. All of these vacuum cleaners require less than 17 amperes and can be reasonably used on swing stages. These vacuum cleaners were selected because the design features differ. The range of filter area for the final filters is 0.4 to 2.1 m2. Two of the vacuum cleaners use vacuum cleaner bags as prefilters. All of these vacuum cleaners are available with optional filters that are 99.97% efficient at 0.3 ?m (HEPA filters). Experimentally, aerosol penetration through the Bosch and DustControl vacuum cleaners was under, respectively, 5% and 2% at 0.4 ?m.15
The bodies of the Dust Control and Tiger-Vac vacuum cleaners have the shape of a cyclone with the final filter functioning as the vortex finder (Figure 3). This design is intended to separate the debris from the air upstream of the final filter. The settled debris is collected into a plastic bag or a pan. These vacuum cleaners were included in the study because the cyclones may remove airborne debris prior to filtration. Perhaps, this enhances flow rate maintenance.
Figure 3. Schematic diagram of the four vacuum cleaners listed in Table 3.
A. Tiger Tac Vacuum Cleaner
B. DustControl 2700 Vacuum Cleaner
C. Bosch Vacuum cleaner
D. Dust Director Vacuum Cleaner
| Table 2. Vacuum cleaners selected for study | ||||
Manufacturer |
Model |
Cost |
Filtration |
Description of filter cleaning for final filter |
Bosch (Mt. Prospect Ill) |
3931 |
$400 |
Bag and Filter with a surface area of 0.86 m2 . The advertised filter efficiency is 99.93% of particles at 0.3 ?m and larger. |
Electric motor used to vibrate final filter when vacuum cleaner motor is off. |
DustControl (Norsborg Sweden) |
2700 |
$1600 |
Filter and, sometimes used with cyclone. This vacuum cleaner has a tangential inlet. The filter area is 1.5 m2. The advertised filtration efficiency is “better than 99.9%”. |
Cover inlet to vacuum cleaner and release vacuum removing plastic cover from a vent hole. This causes the final filter to flex and drop material into a plastic bag. |
Industrial Contractor’s Supply Dust Director (Pittsburgh Pa) |
Contractor Plus Vacuum Cleaner |
$800 |
A paper vacuum cleaner bag and a final filter with an area of 0.4 m2 . Final filter efficiency is 99.97% at 0.3 ?m. This manufacturer does not have model numbers. |
Manually shake vacuum cleaner, turn vacuum cleaner on and off. This vacuum cleaner is not supposed to need cleaning. |
Tiger-Vac (Laval Quebec CA) |
2D-20DT |
$1500 |
This vacuum cleaner incorporates a cyclone as a prefilter and a 99.97% at 0.3 ?m final filter. The final filter has an area of 2.11 m2 . |
Manually pulse vacuum clean by blocking the vacuum cleaner inlet and opening the vacuum release flap. Turn motor on and off. The debris falls into a detachable pan. |
Experimental Equipment
A venturi meter (Primary Flow Signal, Tulsa, OK ) was used to measure vacuum cleaner airflows.16 This venturi meter has an inlet diameter of 2.067 inches and a throat diameter of 1.088 inches. Air flow is computed from the pressure difference between the inlet and the throat. The pressure differential was measured with a u-tube manometer and flow rate is computed as described in an ISO standard.17 The uncertainty with which the flow coefficient is known limits the accuracy of the flow rate measurement. For pipe Reynolds numbers larger than 75000, the uncertainty in the flow rate is under 1%. The ISO standard indicates that uncertainty is reduced from 2.5% to 1% as Reynolds number increases from 10,000 to 150,000. For flow rates obtained from this venture meter, the uncertainty in the flow rates is better than 1- 2 cfm over a flow rate range of 12 to 230 cfm.
U-tube manometer (1211 Slack Tube® Manometer, Dwyer Instruments Inc. Michigan City, IN) was used to measure vacuum cleaner static pressures, pressure differentials across the venturi meter. The pressure range for this manometer is 120 inches of water and it is readable to the nearest 0.5 inches of water.
Pressure transducers (SmartReaderPlus4 -30A-part-01-0116, ACR Systems, Surrey, BC) were used to measure and record vacuum cleaner static pressures during testing. This pressure logger is a digital barometer that measures and records absolute pressure with 12-bit resolution over the range 0-30 pounds per square inch (psia). Thus, this instrument records pressure to the nearest 0.2 inches of water. The pressure transducers read pressures that were 4.90 inches of water less than a barometer (Nova Barometer, Princo, Southampton PA). Appendix E describes a regression equation for relating pressure transducers results to absolute pressures measured with a barometer and a u-tube manometer.
A shipping and receiving balance (Pelouze model 4010, W.W. Grainger Inc. Lake Forest, Ill) with 150 lb of capacity (68 kg) used to record the mass of material transferred to the vacuum cleaner. This balance weighs material to the nearest 0.2 pounds. In addition a balance (model SP602, OHaus, Grainger Inc. Lake Forest, Ill) was used to weigh filters. This balance has a readability of 0.1 grams and it was used for weighing vacuum cleaner filters.
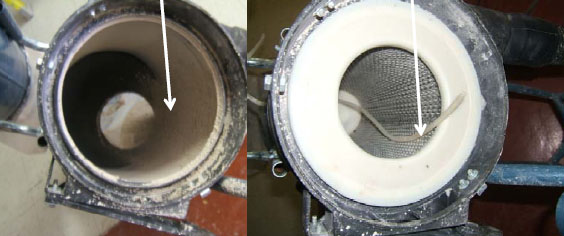
The mortar removal debris was supplied by Western Construction Group in August of 2008. It was obtained from a job site in the Midwest. This company uses hoods and vacuum cleaners to control the dust generated by mortar removal as described in prior publication.10 This debris was collected in the DustControl vacuum cleaners that were used without cyclonic pre-separators shown in Figure 3B.
Experimental Procedures
Prior to studying how debris accumulation affects vacuum cleaner flow rate and the pressure loss across the vacuum cleaners’ filters, the relationship between vacuum cleaner air flow and static pressure at the inlet to the vacuum cleaner motor was determined using procedures that were developed earlier.10 The filters were removed from the vacuum cleaner and small holes were drilled into their body, flexible tubing was inserted into these holes. The holes were sealed with silicone caulk. The flexible tubing was used to measure vacuum cleaner static pressure and this tubing was connected to the pressure loggers or the a U-tube manometer.
The experimental apparatus shown in Figure 4 was used to determine the vacuum cleaner fan curve. The outlet of the venture meter was connected by 2-inch diameter, schedule 40 PVC pipe and flexible hose to the inlet of the vacuum cleaner. The vacuum cleaner air flow was obtained by measuring the pressure differential across a venturimeter (Primary Flow Signal) with a u-tube water manometer. Then, measured pressure differential was used to compute an air flow rate as described by an ISO standard.18 The pressure logger (SmartReaderPlus4 -30A- 128kb memory – part-01-0116, ACR Systems, Surrey, BC) was used to measure vacuum cleaner static pressure during testing and this data was used to compare the static pressures measured with the pressure transducers to the static pressures measured with the venturi meter. The formula for computing vacuum cleaner static pressure (δPv_sp) from the pressure transducer measurements is: δPv_sp= Pambient -Pmeasured. The terms Pambient and Pmeasured are, respectively, the absolute pressures measured by the pressure transducer when the vacuum cleaner was off and when it was running.
Figure 4. Apparatus for obtaining vacuum cleaner fan curve.
A total of at least 10 equally spaced flow rates and vacuum cleaner static pressures were obtained by adjusting the gate valve shown in Figure 4 for each of the vacuum cleaners. Regression analysis (Regression tool that is a component of Microsoft Excel 2007, Microsoft, Redmond WA) was used to fit the data to this model described by equation 1. The regression analysis was used to compute the slope, intercept, the standard error of estimate, fraction of variability explained by the model, and the standard error for the intercept and slope.
Vacuum Cleaner Flow Loss, Changes in Filter Pressure Losses, and Accumulated Debris
The cumulative effect of material debris accumulation upon the pressure loss across vacuum cleaners’ filters and air flow was determined. In increments of 5 pounds, 35 pounds of debris were sucked into vacuum cleaners. Before and after each five pound increment, vacuum cleaner air flows and pressure losses were measured as shown in Figure 5. The mortar debris used for the test was previously obtained from the Western Construction Group. As shown in Figure 5, the pressure difference across the final filter and the initial air cleaner were measured with data logging pressure transducers (Smart Reader SRP-004-5G-128K 0-5 PSI-G, ACR Systems, Surray BC, Canada) and with the U-tube manometer. These pressure transducers measure and record pressure differences over the range 0-138 inches of water with a resolution of 0.03 inches of water. To measure the pressure differences, plastic tubing was run from the pressure logger to the appropriate spaces in the vacuum cleaners. This process involved drilling holes in the vacuum cleaner body, the vacuum cleaner hose, and in end caps for cartridge filters. The resulting holes were sealed with a flexible putty or duct tape.
Figure 5. Apparatus for measuring pressures and flows before and after loading vacuum cleaner with mortar debris. When filter pressure losses were measured the venturi meter and pipe was disconnected from vacuum cleaner.
Data collection involved the following steps:
- The final filter was weighed and atmospheric pressure was recorded.
- The vacuum cleaner was turned on. The initial air flow into the vacuum cleaner, was measured using the test apparatus described by Figure 5. The venturi meter pressure differential was used to compute the air flow as described elsewhere.17
- After measuring the air flow, the venturimeter and pipe was disconnected from the apparatus shown in Figure 5. The following pressure measurements were made with the Smart Reader pressure loggers and static pressure measurements were made with the U-tube manometer: in the space between the final filter and the vacuum cleaner motor, and the static pressures upstream and downstream of each filter in the vacuum cleaner. For the Dust Control and Tiger Vac vacuum cleaner, the vacuum cleaner hose remained attached to the vacuum cleaner. For the Dust Director and Bosch vacuum cleaners, the vacuum cleaner hose was removed because it was impractical to insert a hose through both the vacuum cleaner hose and the inlet to the vacuum cleaner. Thus, we simply removed the vacuum cleaner hose and inserted the tubing for the static pressure measurements directly into the vacuum cleaner bag. After making this measurement, the hose was removed from the vacuum cleaner bag.
- The mortar removal debris was in bucket that sat on a scale (Pelouze, model 4010 G, item 4TH71, Grainger Supply Company). The vacuum cleaner was turned on and the vacuum cleaner hose was to suck 5.0±0.2 pounds of mortar debris into the vacuum cleaner.
- The hose for measuring the pressure difference across the vacuum cleaner bag was placed back into the vacuum cleaner bag. The procedure described in steps 2 and 3 was used to measure the final air flow and pressures.
- The vacuum cleaner was turned off and the final filter was cleaned, as recommended by the vacuum cleaner manufacturer. In the case of the DustDirector vacuum cleaner, we simply turned the vacuum cleaner on, while blocking the inlet with a flat block of wood, and simultaneously removing the block and turning the motor off.
- Steps 2-6 were repeated until 35 pounds of debris were sucked into the vacuum cleaner. Then, the final filter was re-weighed.
Data analysis
To obtain the vacuum cleaner fan curves, air flows were computed from the pressure differential across the venturi meter as described elsewhere.17 Regression analysis was used to fit the data to model described by equation 1. Regression analysis performed using the data analysis tools in the 2007 Excel (Microsoft, Redmond WA). These vacuum cleaner fan curves were used to estimate air flow during filter pressure differential measurements. Air flow measurements with a venturi meter causes an additional pressure loss of 7% of the measured pressure differential for the venturi meter used in this study.19
This study was conducted to evaluate how debris accumulation affects the resistance to air flow for the filters with in a vacuum cleaner. The pressure differences across the vacuum cleaner filters were computed for each 5-pound increment of debris. The air flow was computed from the vacuum cleaner static pressures measured with the pressure transducer. Filter resistance, Kfilter , was computed for each filter as described by equation 2. For each filter, the individual values of Kfilter , were plotted as function cumulative mass debris transferred to the vacuum cleaner. In addition, regression analysis was performed which modeled Kfilter as simple linear function of cumulative mass of debris transferred to the vacuum cleaner.
To examine the effect debris accumulation upon vacuum cleaner air flows, vacuum cleaner air flows were computed directly from the venturi meter pressure differentials.17 For each vacuum cleaner, air flows were plotted as function the cumulative mass of debris transferred to the vacuum cleaner. Regression analysis was performed which modeled vacuum cleaner air flow as simple linear function of cumulative mass of debris transferred to the vacuum cleaner.
RESULTS AND FINDINGS
The data are listed in the Appendices. Appendix A-D lists the data collected obtained for each vacuum cleaner. Appendix E presents data and analyses which shows that the pressure transducers measure an absolute pressure, at the inlet to the vacuum cleaner motor, that is equivalent to an absolute pressure obtained with the u-tube manometer and a barometer.
The vacuum cleaner fan curves are well described by the equation 1 as flow rate decreases linearly with increased vacuum cleaner static pressure. As listed in Table 3, the R2 statistic for this model was better than 0.989 and the standard error of estimates for the four vacuum cleaners were between 1.3 and 2.7 cfm. The slope of the fan curve shows how flow decreases with increased vacuum cleaner static pressure. The impact of pressure loss upon air flow is simply the product of the slope and the pressure loss. The standard error of estimate for the slope is less than 4% slope. This variability is trivial compared to the variability in the pressure loss and filter resistance data that is presented latter in this report.
| Table 3. Summary statistics describing vacuum cleaner fan curves. | ||||
| Regression statistics | Vacuum Cleaner | |||
| Tiger Vac | Dust Control | Bosch | Dust Director | |
Intercept (cfm) |
90 |
120 |
119 |
119 |
Slope (cfm/inch of water) |
-1.13 |
-1.43 |
-1.63 |
-1.32 |
Std error of estimate (cfm) |
1.37 |
1.28 |
2.49 |
2.67 |
Std error, intercept (cfm) |
0.61 |
0.81 |
1.56 |
2.39 |
Std error, slope (cfm/inch of water) |
0.015 |
0.017 |
0.037 |
0.042 |
N |
19 |
16 |
15 |
12 |
R2 |
0.997 |
0.998 |
0.993 |
0.989 |
| Table 4. Probability that chance explained the fit of the regression line to the data. | |||||
| Figure number | Dependent variable in Figure | Vacuum Cleaner | |||
| Tiger Vac | Dust Control 2700 | Bosch | Dust Director | ||
| 6 | vacuum cleaner air flow before adding 5 pound increments | 0.6.37 | 0.4999 | P<0.0001 | 0.0003 |
| vacuum cleaner air flow after adding 5 pound increment | 0.6987 | 0.2904 | P<0.0001 | P<0.0001 | |
| 7 | K, flow resistance for vacuum cleaner bag, after cleaning | P<0.0001 | 0.0007 | ||
| K, flow resistance for vacuum cleaner bag, before cleaning | P<0.0001 | P<0.0001 | |||
| K, flow resistance for filter between vacuum cleaner bag and final filter, before cleaning | 0.0021 | ||||
| K, flow resistance for filter between vacuum cleaner bag and final filter, after cleaning | 0.0296 | ||||
| 8 | K, flow resistance for final filter after cleaning | 0.0123 | 0.1945 | P<0.0001 | P<0.0001 |
| K, flow resistance for final filter before cleaning | 0.0140 | 0.0723 | P<0.0001 | 0.0032 | |
| Note: Blank cell indicates that vacuum cleaner does not have this filter | |||||
The flow rate provided by the Tiger-Vac and the DustControl vacuum cleaners were largely unaffected by debris accumulation (Figures 6A and 6B). Debris accumulation had very little affect upon flow rate measured before and after cleaning the filters as values of R2 were under 0.06 and this was not statistically significant (Table 4). The Tiger-Vac and the DustControl vacuum cleaners used cyclones in an effort to keep much of the debris before the air flows through the filters. In contrast, debris accumulation appears to affect the air flow provided by the Bosch and Dust Director vacuum cleaners (Figures 6C and 6D) and debris accumulation and this result was statistically significant as P<0.0003 (Table 4). Furthermore, the slopes of the trend lines in these plots showed that these vacuum cleaners lost between 1.4 and 0.73 cfm per pound of debris accumulation (Figures 6C and 6D). As a result, air flows decreased from 80 to 30 cfm for the Bosch vacuum cleaner (Figure 6C) and from 70 to as low as 30 cfm for the Dust Director vacuum cleaner (Figure 6D).
Figure 6. Airflow as a function of cumulative mass of debris sucked into the vacuum cleaner. Measurements were made before and after loading 5lb of debris into the vacuum cleaner.
The flow rate decreases for the vacuum cleaners which used vacuum cleaner bags, the Bosch and Dust Director vacuum cleaners, are quite noticeable (Figure 6) and are statistically significant (P < 0.0003 in Table 4). The resistance to air flow by the vacuum cleaner bags and prefilters in creases noticeably with debris accumulation (Figure 7) and the difference was significant (P < 0.0007 in Table 4). Before sucking debris into the vacuum cleaner bags and pre-filters, the resistance to air flow is actually under 0.1 inches of water per cfm. With increasing debris accumulation, the resistance to air flow by the vacuum cleaner bags can exceed 1.9 inches of water/cfm. At air flows of 30 cfm, this is a filter pressure loss of 57 inches of water. based upon the slope of the vacuum cleaner fan curves for the Bosch and Dust Director vacuum cleaners (Table 3), a 57 inch of water pressure would cause the vacuum cleaner air flows to decrease by 91 to 74 cfm, respectively. With no pressure loss, these vacuum cleaners provide an air flow of 119 cfm (the intercepts for the fan curves listed in Table 1.) Considering only the pressure loss caused by the vacuum cleaner bags, the flow moved by the Bosch and the Dust Director vacuum cleaners is estimated to be under 27 and 43 cfm, respectively. Clearly, increased pressure loss through the vacuum cleaner bags explains why the Bosch and the Dust Director vacuum cleaners lose air flow with increased debris accumulation.
Figure 7. Flow rate resistance for pre-filters into Bosch (8A) and Dust Director (8B and 8C) vacuum cleaners. These measurements were made before and after cleaning the filters when adding 5 cumulative lb of debris.
The filter resistance for final filters in each vacuum cleaner was not as high as the resistance found for bags and for pre-filters in Bosch and Dust Director vacuum cleaners. Figure 8 shows that the filter resistances do not increase dramatically with cumulative mass debris loaded into each vacuum cleaner. The slopes for the trend lines in Figure 8 are smaller than 0.0013 inches of water/cfm/pound of debris accumulation. This indicates that the resistance to air flow for the final filters is gradually increasing and these filters will eventually need to changed.
Figure 8. Filter pressure loss/airflow for each vacuum cleaner. These measurements were made before and after cleaning the filters when adding 5 cumulative lb of debris.
DISCUSSION
Vacuum cleaners with cyclones provided a more stable airflow and were not affected by debris accumulation. These vacuum cleaners provided airflow between 78 and 73 cfm (Figure 6A and 6B). Debris accumulation can dramatically increase the resistance to air flow through vacuum cleaner bags (Figure 7A and 7B) and cause airflows to decrease from 85 to 30 cfm (Figures 6C and 6D). Apparently vacuum cleaners with vacuum cleaner bags should only be used for applications where 30 cfm provides adequate dust control. These data were generated with debris collected at a construction site. This may have allowed the powder to agglomerate. Clearly, field data would be useful to verify the conclusions of the laboratory study. However, the pressure losses through the vacuum cleaner bags clearly explain the air flow losses that were reported by Collingwood and Heitbrink.10
As documented in Table 2, the vacuum cleaners with cyclones cost about $1500 and vacuum cleaners with bags cost about $400 for the Bosch and $800 for the Dust Director vacuum cleaners. However, the vacuum cleaner bags can be an important operating cost because they need to be changed about 2-3 times per day after collecting 10 to 15 lb of debris. The cost for the vacuum cleaner bags are $5 per bag for the Dust Director vacuum cleaner.20 The list price for a package of 5 Bosch vacuum cleaner bags is $38.38 and the advertised price is $28.99.21 Therefore, the vacuum cleaner bags cost at least $5 per bag. To maintain airflow the workers will need to change out the vacuum cleaner bags at least twice per day. The capital cost difference for using a vacuum cleaner with a cyclone and the Bosch vacuum cleaner will be $1100. The payback time of this capital cost is about 110 days of grinding. The actual payback time will depend upon the operation. Clearly, the higher capital cost vacuum cleaners will be more cost-effective if the service life is longer than 110 days of grinding. The payback time may be less than a construction season. Thus, contractors should consider using the higher cost vacuum cleaners to protect the workers health and to reduce operating cost. Health and safety professionals should use this payback time to promote the use of cyclonic vacuum cleaners.
The vacuum cleaners should include vacuum cleaner static pressure gauges so that workers can track the vacuum cleaner airflow. Gauges that measure pressure differential of 100” of water cost $48.22 Workers should be trained on how to interpret this vacuum cleaner static pressure. When static pressure is too low workers need to take action to recover airflow. For vacuum cleaners with vacuum cleaner bags, the workers need to know when to change these bags to maintain airflow. Airflow requirements will actually vary depending on the type of job being done and there should be minimum air flow rate for each type of dust generating task such as mortar removal, concrete grinding, concrete drilling, ect.1
Because vacuum cleaner bags caused decreased flow rates and increased work place dust exposure, researchers and practitioners should measure and log or record flow rates during actual debris accumulation. Such results are needed to develop an overall plan to control the worker’s dust exposure. These recommendations include the frequency in which the worker 23 needs to stop and address flow rate decreases by pulsing filters or changing vacuum cleaner bags.
CONCLUSION
When much debris is being generated during tasks such as mortar grinding, cyclones should be used as the first stage of filtration. Cyclones can keep the debris accumulation from clogging filters and help the vacuum cleaner maintain air flow. Debris accumulation in vacuum cleaner bags caused pressure losses that were nearly 57 inches of water and this excessive pressure loss reduced the air flow provided by the vacuum cleaners.
BIBLIOGRAPHY
- Flanagan ME, Seixas N , Becker P, Takacs B, Camp J: Silica Exposure on Construction Sites: Results of an Exposure Monitoring Data Compilation Project, Journal of Occupational and Environmental Hygiene, 3: 144–152 (2006)
- Linch KD, M.W., Althouse RB, Groce DW, Hale JM: Surveillance of respirable crystalline silica dust using OSHA compliance data (1979-1995). Am J Ind Med, 34: 547- 558 (1998).
- NIOSH (2005): NIOSH Pocket Guide to Chemical Hazards. CDC (NIOSH) publication Publication No. 2005-151. Cincinnati Ohio Viewed on November 6th at: http://www.cdc.gov/niosh/npg/npgd0553.html
- NIOSH (2002): Health Effects of Occupational Exposure to Respirable Crystalline Silica. DHHS (NIOSH) Publication No. 2002-129. Cincinnati Ohio.
- American Conference of Governmental Industrial Hygienists (2006): 2006 TLVs and BEIs Based on the Documentation of the Threshold Limit Values for Chemical Substances and Physical Agents &Biological Exposure Indices. Cincinnati Ohio.
- ACGIH (2006): Documentation of the TLVS – Silica, Crystalline: alpha quartz and Cristobalite. Cincinnati Ohio: ACGIH Publications Office, 17 pp.
- Steenland K; Sanderson W (2001): Lung cancer among industrial sand workers exposed to crystalline silica. Am J Epidemiol 153:695–703 (2001).
- Heitbrink WA and Bennett (2006): A Numerical and Experimental Investigation of Crystalline Silica Exposure Control During Tuck-Pointing. Journal of Occupational and Environmental Hygiene, 3: 366–378.
- American Conference of Governmental Industrial Hygienists (2006): Industrial Ventilation – A Manual of Recommended Practice. 26th edition, Cincinnati Ohio.
- Collingwood S, Heitbrink WA (2007): Field Evaluation of an Engineering Control for Respirable Crystalline Silica Exposures During Mortar Removal. Accepted for publication, February 12, 2007, Journal of Occupational and Environmental Health.
- Nij ET, Hilhorst S, Spee T, Spierings J, Steffens F, Lumens M, Heederik D (2003): Dust Control Measures in the Construction Industry. Ann. occup. Hyg., Vol. 47: 211–218, 2003.
- Soderberg G.(1987): Handbook for Planning and Dimensioning of Spot Extraction. Norsborg Sweden: DustControl.
- Nevers DE (1995): Air pollution control Engineering. New York: McGraw Hill. P. 232.
- Hinds WC (1999): Aerosol Technology-Properties, Behavior, and Measurement of Airborne Particles. New York: John Wiley and Sons.
- Collingwood SC (2006): Research to practice :evaluations and recommendations for local exhaust ventilation designed to reduce respirable crystalline silica and dust exposures experienced during mortar removal. Ph. D. Thesis, University of Iowa. Hardin Library For Health Sci Thesis T2006 .C779. Iowa City.
- Halmi D (1974): Metering Performance Investigation and Substantiation of the Universal Venturi Tube. Part 1 Hydaulic Sahpe and Discharge Coefficient Transactions of ASME –Journal of Fluids Engineering. 96(2):124-138.
- International Standards Organization (2003): ISO 5167-4 Measurement of fluid flow by means of a pressure differential device inserted in the circular cross-section conduits running full- Part 4: Venturi Tubes. Case postale 56, CH-1211 Geneva 20, Switzerland.
- International Standards Organization (2003): ISO 5167-4: Measurement of fluid flow by means of a pressure differential device inserted in the circular cross-section conduits running full- Part 4: Venturi Tubes. Case postale 56, CH-1211 Geneva 20, Switzerland.
- Miller RW (1988): Flow Measurement Engineering Handbook. 2nd ed. New York: McGraw Hill, page 6-30.
- Masonry / Concrete Ultra-Fine Dust Extraction Vacuum. Viewed on April 8th 2008 at: http://www.icscompany.net
- Bosch Vaccum Dust Bags (Pack of 5). Viewed on April 8th 2008 at: http://www.amazon.com/Bosch-Vaccum-Dust-Bags-Pack/dp/B0000AV7AW
- Grainger 2008-2009 catalog 399. W.W. Grainger Inc. Lake Forest, Ill. Page 749.
CONTENT OF THE APPENDICIES
-
APPENDIX A. Data from Tiger Vac Vacuum Cleaner
- Figure A?1. Location of static pressure measurements on the Tiger Vac vacuum cleaner.
- Table A1. Fan curve air flow through Tiger Vac vacuum Cleaner 12/06/2007
- Table A2. Environmental Conditions and final filter weights
- Table A3. Pressure losses and air flows through Tiger Vac vacuum cleaner 11/09/2007
Round 1
- Table A4. Pressure losses and air flows through Tiger Vac vacuum cleaner 11/13/2007
Round 2
- Table A5. Pressure losses and air flows through Tiger Vac vacuum cleaner 11/13/2007
Round 3
- Figure B?1. Location of static pressure measurements for DustControl 2700 vacuum cleaner
- Table B1. Fan curve air flow through DustControl vacuum Cleaner 08/30/2007
- Table B2. Weight gain of filter filter and test conditions
- Figure B?2. Fan curve for DustControl 2700 Vacuum Cleaner
- Table B3. Pressure loss and air flows through DustControl 2700 Vacuum Cleaner 09/07/2007 Round 1
- Table B4. Pressure losses and air flows through DustControl 2700 vacuum cleaner: 09/13/2007 Round 2
-
Table B5. Pressure losses and air flows through DustControl 2700 vacuum cleaner:
09/13/2007 Round 3
- Figure C?1. Locations for measuring pressures in Bosch vacuum cleaner
- Table C1. Fan curve air flow through Bosch vacuum Cleaner 08/30/2007
- Figure C?2. Fan curve for Bosch vacuum cleaner
- Table C2. Filter weights and environmental conditions
- Table C3. Pressure loss and air flows through Bosch vacuum Cleaner 9/14/2007 Round 1
- Table C4. Pressure loss and air flows through Bosch vacuum Cleaner 9/14/2007 Round 2
- Table C5. Pressure loss and air flows through Bosch vacuum Cleaner 9/14/2007 Round 2
- Figure D?1. Locations for measuring static pressures inside the Dust Director vacuum cleaner
- Table D1. Fan curve air flow through Dust Director vacuum Cleaner 08/30/2007\
- Figure D?2. Fan curve for Dust Director vacuum cleaner
- Table D2. Filter weights and environmental conditions
- Table D3. Pressure loss and air flows through Dust Director vacuum cleaner 10?04?2007 Round 1
- Table D4. Pressure loss and air flows through Dust Director vacuum cleaner 10?04?2007 Round 2
- Table D5. Pressure loss and air flows through Dust Director vacuum cleaner 10?11?2007 Round 3
- Table E1. Comparison of pressures
- Table E2. Regression analyses for predicting actual pressures from pressure transducer response
APPENDIX A. Data from Tiger Vac Vacuum Cleaner.
Figure A?1. Location of static pressure measurements on the Tiger Vac vacuum cleaner.
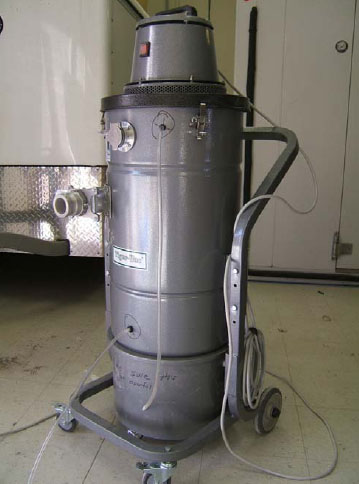
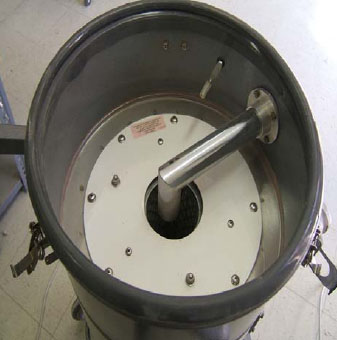
Table A1. Fan curve air flow through Tiger Vac vacuum Cleaner 12/06/2007 |
||
| Static pressure (difference from atmospheric pressure) in inches of water | Venturimeter Pressure Difference (inches of water) | Vacuum cleaner Air flow (cfm) |
80.2 |
0 |
0.00 |
62.4 |
0.35 |
15.15 |
59.9 |
0.6 |
19.96 |
56.8 |
0.9 |
24.57 |
53.9 |
1.25 |
29.08 |
51.3 |
1.5 |
31.93 |
47.6 |
1.9 |
36.04 |
43.5 |
2.45 |
41.03 |
39.7 |
3.15 |
46.63 |
33.3 |
4 |
52.63 |
29.4 |
4.8 |
57.69 |
24 |
5.75 |
63.15 |
19.85 |
6.6 |
67.64 |
16 |
7.45 |
71.84 |
13.9 |
7.7 |
73.02 |
11.85 |
8.1 |
74.87 |
10.9 |
8.4 |
76.17 |
9 |
9 |
78.81 |
7.8 |
9.5 |
80.93 |
Table A2. Environmental Conditions and final filter weights |
|||||
|
Barometric Pressure (mm of Hg) |
Temperature (Celsius degrees) |
Weight of filter before adding 35 lb of debris (grams) |
Weight of filter after adding 35 lb of debris (grams) |
|
Round 1 11/09/2007 |
745.3 |
20 |
2171 |
2306 |
|
Round 2 11/13/2007 |
739.0 |
22.2 |
2265 |
2310 |
|
Round 3 11/13/2007 |
739.0 |
22.2 |
2306 |
2357 |
|
Table A3 Pressure losses and air flows through Tiger Vac vacuum cleaner 11/09/2007 Round 1
Table A4. Pressure losses and air flows through Tiger Vac vacuum cleaner 11/13/2007 Round 2
Table A5. Pressure losses and air flows through Tiger Vac vacuum cleaner 11/13/2007 Round 3
APPENDIX B. Data from DustControl 2700 Vacuum Cleaner
A. Static pressure measurements in vacuum cleaner body.
Static pressures were measured along the wall of the body of the vacuum cleaner and inside the vacuum cleaners cartridge filter.
B. Static pressure measurements in cyclone.
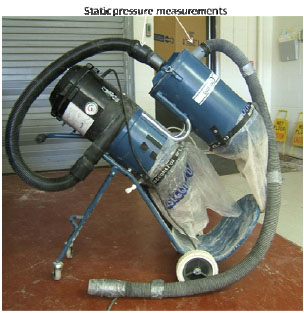
Table B1. Fan curve air flow through DustControl vacuum Cleaner 08/30/2007 |
||||||
Static pressure (difference from atmospheric pressure) in inches of water1 |
Absolute pressure in vacuum cleaner pressure in (psia)2 |
Absolute pressure, (Pressure transducer 55481) (psia) |
Absolute Pressure (Pressure transducer data 53748) (psia) |
Venturimeter pressure differential (inches of water) |
Absolute pressure from the manometer (psia) 1 |
vacuum cleaner air flow (cfm) |
0 |
14.46 |
14.287 |
14.316 |
0 |
0.00 |
0.00 |
69.1 |
11.95 |
11.752 |
11.793 |
0 |
2.51 |
0.00 |
61.4 |
12.23 |
12.030 |
12.060 |
0.23 |
2.23 |
12.23 |
54.3 |
12.49 |
12.300 |
12.328 |
0.81 |
1.97 |
23.28 |
46.2 |
12.78 |
12.586 |
12.629 |
1.85 |
1.68 |
35.55 |
41.5 |
12.95 |
12.771 |
12.796 |
2.62 |
1.51 |
42.46 |
36.3 |
13.14 |
12.965 |
12.979 |
3.6 |
1.32 |
49.90 |
31 |
13.33 |
13.133 |
13.172 |
4.5 |
1.13 |
55.85 |
27.2 |
13.47 |
13.285 |
13.305 |
5.45 |
0.99 |
61.48 |
24.2 |
13.58 |
13.403 |
13.431 |
6.4 |
0.88 |
66.62 |
20.7 |
13.71 |
13.520 |
13.548 |
7.4 |
0.75 |
71.60 |
17.3 |
13.83 |
13.638 |
13.665 |
8.4 |
0.63 |
76.22 |
14.9 |
13.92 |
13.731 |
13.739 |
9.1 |
0.54 |
79.29 |
13 |
13.99 |
13.798 |
13.823 |
9.8 |
0.47 |
82.23 |
8 |
14.17 |
13.984 |
13.999 |
11.4 |
0.29 |
88.54 |
6 |
14.24 |
14.051 |
14.066 |
12.3 |
0.22 |
91.89 |
Barometric Pressure: 747.5 mm of Hg |
||||||
Temperature 25 °C |
||||||
1 Absolute pressure is the difference between the barometric pressure and the U-tube pressure. |
||||||
2 Absolute pressure in pounds per square inch. |
||||||
Table B2. Weight gain of filter filter and test conditions. |
||||||
|
Barometric Pressure (mm of Hg) |
Temperature (°C) |
Weight of filter before adding 35 lb of debris (grams) |
Weight of filter after adding 35 lb of debris (grams) |
||
Round 1 09/07/2007 |
736.5 |
24.5 |
768 |
907 |
||
Round 2 09/13/2007 |
741.5 |
24.3 |
863 |
864 |
||
Round 3 09/13/2007 |
741.5 |
24.3 |
864 |
8481 |
||
| 1 This was filter that had been at job sites. The debris fell off on the way to the scale. | ||||||
Figure B-2. Fan curve for DustControl 2700 Vacuum Cleaner.
Table B3. Pressure loss and air flows through DustControl 2700 Vacuum Cleaner 09/07/2007 Round 1
Table B4. Pressure losses and air flows through DustControl 2700 vacuum cleaner: 09/13/2007 Round 2
Table B5. Pressure losses and air flows through DustControl 2700 vacuum cleaner: 09/13/2007 Round 3
APPENDIX C. Data from Bosch Vacuum Cleaner
Figure C-1. Locations for measuring pressures in Bosch vacuum cleaner.
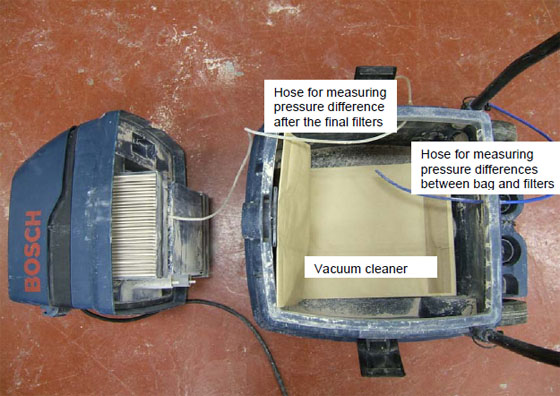
Table C1. Fan curve air flow through Bosch vacuum Cleaner 08/30/2007 |
|||||
Static pressure (difference from atmospheric pressure) in inches of water |
Absolute Pressure at inlet to vacuum cleaner motor estimated from static pressure1 (psia) |
Absolute Pressure from transducer 55481 (psia) |
Absolute Pressure from transducer 53748 (psia) |
Venturimeter Pressure difference (inches of water) |
Vacuum cleaner air flow from venturi meter (cfm) |
70.8 |
11.88 |
11.685 |
11.701 |
0 |
0.00 |
64.2 |
12.12 |
11.921 |
11.943 |
0.24 |
12.49 |
57.8 |
12.35 |
12.157 |
12.161 |
0.82 |
23.43 |
53.9 |
12.50 |
12.291 |
12.328 |
1.5 |
31.93 |
49.4 |
12.66 |
12.476 |
12.478 |
2.35 |
40.17 |
44.8 |
12.83 |
12.62 |
12.654 |
3.35 |
48.11 |
41.5 |
12.95 |
12.746 |
12.771 |
4.35 |
54.90 |
37.5 |
13.09 |
12.881 |
12.904 |
5.4 |
61.20 |
32.7 |
13.27 |
13.066 |
13.088 |
6.65 |
67.90 |
30.1 |
13.36 |
13.15 |
13.172 |
7.4 |
71.60 |
26.7 |
13.48 |
13.285 |
13.297 |
8.4 |
76.22 |
24.6 |
13.56 |
13.361 |
13.38 |
9.1 |
79.29 |
22.4 |
13.64 |
13.445 |
13.447 |
9.8 |
82.23 |
16.9 |
13.84 |
13.638 |
13.665 |
11.8 |
90.05 |
8.2 |
14.15 |
13.967 |
13.99 |
15 |
101.06 |
1 Absolute pressure is the difference between the barometric pressure and the U-tube pressure. |
|||||
Figure C-2. Fan curve for Bosch vacuum cleaner.
Table C2. Filter weights and environmental conditions. |
|||||||
|
Barometric Pressure (mm of Hg) |
Temperature (Celsius degrees) |
Weight of filter 1 before adding 35 lb of debris (grams) |
Weight of filter 1 after adding 35 lb of debris (grams) |
Weight of filter 2 before adding 35 lb of debris (grams) |
Weight of filter 2 after adding 35 lb of debris (grams) |
Final weight of the vacuum cleaner bag (lb) |
Round 1 09/14/2007 |
743.6 |
23.2 |
438 |
439 |
439 |
440 |
35.2 |
Round 2 09/14/2007 |
743.6 |
23.2 |
439 |
439 |
440 |
441 |
36.2 |
Round 3 09/20/2007 |
745.1 |
24 |
439 |
442 |
441 |
442 |
35.2 |
Table C3. Pressure loss and air flows through Bosch vacuum Cleaner 9/14/2007 Round 1
Table C4. Pressure loss and air flows through Bosch vacuum Cleaner 9/14/2007 Round 2
Table C5. Pressure loss and air flows through Bosch vacuum Cleaner 9/14/2007 Round 2
APPENDIX D. Data for Dust Director Vacuum Cleaner Fan Curve (serial number PO7F14792)
Figure D-1. Locations for measuring static pressures inside the Dust Director vacuum cleaner. After sucking 5 pounds of debris into the vacuum cleaner, the vacuum cleaner hose was removed and manometer hose was inserted into the bag. Also, holes were drilled in the body of the vacuum cleaner tank and hoses were inserted into the spaces between the filters. And after the final filter.
 |
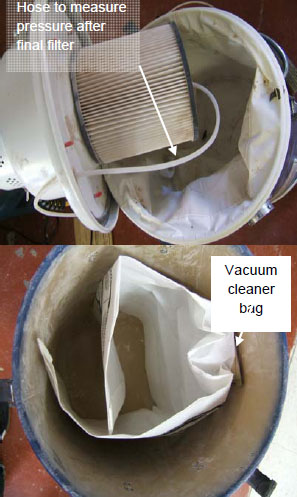 |
Table D1. Fan curve air flow through Dust Director vacuum Cleaner 08/30/2007 |
|||||
Static pressure (difference from atmospheric pressure) in inches of water |
Pressure in psia |
Pressure transducer data 55481 (psia) |
Pressure transducer data 53748 (psia) |
Venturimeter Pressure difference (inches of water) |
vacuum cleaner air flow (cfm) |
86.5 |
11.30 |
11.104 |
11.141 |
0 |
0.00 |
79.9 |
11.54 |
11.323 |
11.392 |
0.22 |
11.95 |
72.5 |
11.81 |
11.609 |
11.626 |
0.79 |
22.98 |
67.3 |
12.00 |
11.794 |
11.826 |
1.55 |
32.47 |
61.2 |
12.22 |
12.013 |
12.044 |
2.5 |
41.46 |
55.7 |
12.42 |
12.224 |
12.253 |
3.4 |
48.47 |
49.3 |
12.65 |
12.451 |
12.478 |
4.5 |
55.85 |
44.7 |
12.82 |
12.637 |
12.611 |
5.35 |
60.92 |
39.6 |
13.00 |
12.805 |
12.829 |
6.5 |
67.13 |
35 |
13.17 |
12.973 |
12.996 |
7.4 |
71.60 |
30.7 |
13.33 |
13.133 |
13.147 |
8.3 |
75.78 |
29.3 |
13.38 |
13.175 |
13.197 |
8.7 |
77.55 |
0 |
14.44 |
14.245 |
14.258 |
0 |
0.00 |
Barometric pressure 746.6 mm of Hg |
|||||
Temperature 24.5 C |
|||||
Figure D-2. Fan curve for Dust Director vacuum cleaner.
Table D2. Filter weights and environmental conditions. |
|||||||
|
Barometric Pressure (mm of Hg) |
Temperature (Celsius degrees) |
Weight of filter 1 (green) before adding 35 lb of debris (grams) |
Weight of filter 1 (green) after adding 35 lb of debris (grams) |
Weight of filter 2 before adding 35 lb of debris (grams) |
Weight of filter 2 after adding 35 lb of debris (grams) |
Final weight of the vacuum cleaner bag (lb) |
Round 1 10/04/2007 |
741.5 |
24.7 |
281 |
291 |
385 |
386 |
36.2 |
Round 2 10/04/2007 |
741.5 |
24.7 |
291 |
297 |
386 |
386 |
35.8 |
Round 3 10/11/2007 |
743.9 |
22.0 |
297 |
308 |
392 |
394 |
35.8 |
Table D3. Pressure loss and air flows through Dust Director vacuum cleaner 10-04-2007 Round 1
Table D4. Pressure loss and air flows through Dust Director vacuum cleaner 10-04-2007 Round 2
Table D5. Pressure loss and air flows through Dust Director vacuum cleaner 10-11-2007 Round 3
APPENDIX E. Comparison of absolute pressures and pressures obtained from pressure transducers.
During this study, pressure transducers were used to record vacuum cleaner static pressures and compute pressure differentials across filters. During efforts to develop the fan curves for the Bosch, DustDirector and Dust Control vacuum cleaners, simultaneous vacuum static pressures were recorded with the two pressure transducers and with the u?tube manometer. The pressure transducers measure an absolute pressure (Ptransducer) in terms of pounds per square inch absolute (psia). In addition atmospheric pressure Patm was recorded with a mercury barometer in units of mm of hg. The u?tube manometer Putube and barometric pressures Patm were used to compute an estimated absolute pressure Pabs in terms of pressure as follows:
Regression analysis was used to fit the data to the following model:
Pabs = intercept + slope x ptransducer
The data used to perform this regression analysis is listed in Table E1. The results of the regression analysis are listed in Table E2 and the regression results are stated after converting the regression terms which have pressure units of psia to inches of water. The R2 for both pressure transducers was 0.9997. The standard error of estimate was 0.36 inches of water. This term is the standard deviation about the regression Given that pressure losses through the filters was in excess of 10 inches of water and approached 60 inches of water, the errors in measuring filter pressure differences and vacuum cleaner static pressures seem reasonable. Clearly, the u?tube manometer measures static pressures in the vacuum cleaner with minimal error. However, a large u?tube manometer that is 11 feet high is not a device that would be practical for measuring and recording static pressures in vacuum cleaners at a construction site.
Table E1. Comparison of pressures. |
|||
U-tube manometer pressure differential (inches of water) |
barometric pressure (mm of Hg) |
55481 (psia) |
53748 (psia) |
70.8 |
747.5 |
11.685 |
11.701 |
64.2 |
11.921 |
11.943 |
|
57.8 |
12.157 |
12.161 |
|
53.9 |
12.291 |
12.328 |
|
49.4 |
12.476 |
12.478 |
|
44.8 |
12.62 |
12.654 |
|
41.5 |
12.746 |
12.771 |
|
37.5 |
12.881 |
12.904 |
|
32.7 |
13.066 |
13.088 |
|
30.1 |
13.15 |
13.172 |
|
26.7 |
13.285 |
13.297 |
|
24.6 |
13.361 |
13.38 |
|
22.4 |
13.445 |
13.447 |
|
16.9 |
13.638 |
13.665 |
|
8.2 |
13.967 |
13.99 |
|
86.5 |
746.6 |
11.104 |
11.141 |
79.9 |
11.323 |
11.392 |
|
72.5 |
11.609 |
11.626 |
|
67.3 |
11.794 |
11.826 |
|
61.2 |
12.013 |
12.044 |
|
55.7 |
12.224 |
12.253 |
|
49.3 |
12.451 |
12.478 |
|
44.7 |
12.637 |
12.611 |
|
39.6 |
12.805 |
12.829 |
|
35 |
12.973 |
12.996 |
|
30.7 |
13.133 |
13.147 |
|
29.3 |
13.175 |
13.197 |
|
0 |
14.245 |
14.258 |
|
0 |
747.5 |
14.287 |
14.316 |
69.1 |
11.752 |
11.793 |
|
61.4 |
12.03 |
12.06 |
|
54.3 |
12.3 |
12.328 |
|
46.2 |
12.586 |
12.629 |
|
41.5 |
12.771 |
12.796 |
|
36.3 |
12.965 |
12.979 |
|
31 |
13.133 |
13.172 |
|
27.2 |
13.285 |
13.305 |
|
24.2 |
13.403 |
13.431 |
|
20.7 |
13.52 |
13.548 |
|
17.3 |
13.638 |
13.665 |
|
14.9 |
13.731 |
13.739 |
|
13 |
13.798 |
13.823 |
|
8 |
13.984 |
13.999 |
|
6 |
14.051 |
14.066 |
|
| Table E2. Regression analyses for predicting actual pressures from pressure transducer response. | ||
Regression statistics |
Pressure transducer number |
|
serial number 53478 |
serial number 55481 |
|
Intercept (inches of water) |
4.883613 |
4.907729 |
Slope (dimensionless) |
0.999582 |
0.999582 |
Std error of estimate (inches of water) |
0.367395 |
0.367395 |
Std error, intercept (inches of water) |
0.902162 |
0.902162 |
Std error, slope (dimension less) |
0.002526 |
0.002526 |
N |
44 |
44 |
R2 |
0.9997254 |
0.9997254 |