
Evaluation of an Intervention to Reduce Trunk Flexion among Stud Workers
Summary Statement
This study investigated the effect of an intervention system designed to reduce exposure to extreme trunk flexion among stud welders on measures of trunk inclination, muscle activity, and estimated spinal compression.
February 2010
TABLE OF CONTENTS
-
ABSTRACT
KEY INDUSTRY FINDINGS
CONCLUSIONS
SIGNIFICANT RESEARCH FINDINGS
SCIENTIFIC REPORT
-
BACKGROUND
PROCEDURES AND METHODOLOGY
RESULTS
DISCUSSION
CONCLUSIONS, RECOMMENDATIONS, AND FUTURE RESEARCH
LIST OF PRESENTATIONS AND PUBLICATIONS
LITERATURE CITED
Introduction. Low back pain continues to be an important occupational health problem among workers in the construction trades. Ironworkers engaged in welding shear stud connectors are exposed to prolonged, extreme trunk flexion, a risk factor for low back pain. We investigated the effect of an intervention system designed to reduce exposure to extreme trunk flexion among stud welders on measures of trunk inclination, muscle activity, and estimated spinal compression.
Methods. Participants included 10 male, journeyman ironworkers experienced with stud welding techniques and presently employed in the St. Louis metropolitan area. Inclinometry and electromyography (EMG) were used to ascertain trunk posture and activity levels of the erector spinae and upper trapezius muscle groups. For each participant, data were collected for one-half of a work day while using traditional stud welding equipment and for the other half of the same work day while using the intervention system. Paired t-tests were used to compare summary measures related to trunk inclination angle and muscle activation levels between the traditional equipment and the intervention system.
Results. The mean trunk inclination angle was reduced from 34.4° (sd = 10.4°) during use of the traditional equipment to 9.7° (sd = 7.0°) during use of the intervention system. The percentage of time with trunk inclination angles greater than 60° was reduced from 40.0% (sd = 10.1%) during use of the traditional equipment to 4.7% (sd = 5.7%) during use of the intervention system. In general, use of the intervention system resulted in less desirable summary measures of upper trapezius muscle activity as compared to use of the traditional equipment.
Conclusions. The intervention system appears to be effective in reducing exposure to prolonged, extreme trunk flexion among stud welders. Continued development of the system should explore features designed to reduce shoulder forces and improve productivity. Future research efforts should focus on increasing the sample size and including construction site type (i.e., bridge versus building) as an independent variable. In addition, the intervention system should be evaluated for the potential to reduce exposure to welding fume among stud welders.
With the use of the stud welding cart system, researchers found that:
- The percentage of working time spent in the most awkward back postures, bending forward from the waist at a 60° angle or more, decreased from 40% to less than 5%.
- The percentage of working time spent in an upright back posture or in only slight forward bending of the back increased from about 53% to more than 85%.
However, compared to traditional stud welding equipment, the stud welding cart system:
- Increased activity levels by about 30% and resulted in less resting time of important shoulder muscles.
- Neither increased nor decreased activity levels of important back muscles.
The stud welding cart system is effective in minimizing exposure to awkward trunk postures, but further development and research are needed to:
- Incorporate new design features to reduce shoulder loads during its use.
- Investigate the effect of the new design features on shoulder loads.
- Examine the effect of the cart system on exposure to welding fume.
- Examine the effect of the cart system on both ergonomic and fume exposures during both building and bridge construction.
- Formally examine the effect of the cart system on productivity among a larger sample of workers and job sites.
We observed statistically significant improvements in trunk inclination and lateral inclination angles during use of the intervention system for the following summary measures:
- Mean trunk inclination angle decreased during use of the intervention system
- Median trunk inclination angle (50th percentile of the trunk inclination amplitude probability distribution function) decreased during use of the intervention system
- Peak trunk inclination angle (90th percentile of the trunk inclination amplitude probability distribution function) decreased during use of the intervention system
- Percentage of time with trunk inclination angles < 30° increased during use of the intervention system
- Percentage of time with trunk inclination angles > 60° decreased during use of the intervention system
- Percentage of time with lateral inclination angles > 30° decreased during use of the intervention system
We observed statistically significant but less desirable upper trapezius muscle activation levels during use of the intervention system for the following summary measures:
- Mean root-mean-square activity of both the left and right upper trapezius increased during use of the intervention system
- Static activity (10th percentile of the amplitude probability distribution function) of the left upper trapezius increased during use of the intervention system
- Median activity (50th percentile of the amplitude probability distribution function) of the left upper trapezius increased during use of the intervention system
- The percentage of time of muscle rest for both the left and right upper trapezius was reduced during use of the intervention system
Introduction
Historically, work-related musculoskeletal disorders and associated symptoms (MSDs) are common among workers in the construction trades (Schneider, 2001). Multiple reports suggest that low back pain, in particular, is a major source of morbidity and disability among construction workers. In a survey of 996 male and female apprentice sheet metal workers, electricians, plumbers, and operating engineers in Iowa, Illinois, Oregon, and Washington, Merlino et al. (2003) reported a 12-month low back symptom prevalence of nearly 55%. Similarly, Latza et al. (2000) observed a 12-month low back pain prevalence of 50% among a sample of 571 construction workers in Germany. Additional studies have reported similar figures among construction workers in specific trades such as masons (Goldsheyder, Nordin, Weiner, & Hiebert, 2002), concrete workers (Goldsheyder, Weiner, Nordin, & Hiebert, 2004), scaffolders (Elders & Burdorf, 2004), and ironworkers (Forde, Punnett, & Wegman, 2005). According to a review of 1996 workers’ compensation information, low back pain is responsible for about 15% of all construction-related claim cases, 21% of claim costs, and 25% of disability days among construction workers (Courtney, Matz, & Webster, 2002).
Occupational Risk Factors for Low Back Pain
Physical risk factors related to the working environment, including repetitive motion, awkward postures, forceful exertions, and cyclic whole-body vibration have been found repeatedly to be positively associated with low back pain (Bernard, 1997; Burdorf & Sorock, 1997; National Research Council - Institute of Medicine, 2001). Evidence from numerous ecologic, case-control, and cross-sectional studies conducted over the past two decades is supported by the results of more recent prospective cohort studies (Hoogendoorn et al., 2000; Van Nieuwenhuyse et al., 2006).
Ironworkers
Membership in The International Association of Bridge, Ornamental, and Structural Ironworkers exceeds 140,000 individuals in the United States (International Association of Bridge, Ornamental, and Structural Ironworkers, 2007), representing approximately 13% of all unionized construction workers (U.S. Bureau of Labor Statistics, 2007). Additionally, about 70% of ironworkers in the United States are active union members, and an 18% increase in ironworker employment was projected between the years 2000 and 2010 (The Center to Protect Workers' Rights, 2002). Ironworkers are involved in the erection of bridges, multi-story buildings, sports stadiums, and other large-scale structures. Individual workers within the trade tend to specialize, with about 87% of workers performing general on-site ironwork, in-shop fabrication, concrete reinforcement work, ornamental finishing work, rigging work, or welding activities (Stern, Sweeney, & Ward, 1997).
Previous studies of the ergonomic hazards associated with ironwork have focused on concrete reinforcement tasks, such as re-bar tying (Albers & Hudock, 2007; Buchholz, Paquet, Wellman, & Forde, 2003; Dababneh & Waters, 2000; Forde et al., 2005; Vi, 2006). Exposures to physical risk factors among ironworkers specializing in welding activities, such as stud welding, have not been quantified.
Stud Welding
Shear stud connectors are used to reinforce steel and concrete composite materials. In multi-story commercial buildings, for example, concrete floor slabs are poured over corrugated metal decking that has been secured to the steel support beams with shear stud connectors. The shear stud connectors perform several functions: 1)
provide a secure, permanent attachment of the decking to the beams, 2) prevent slippage of the floor slab along the beams, and 3) reduce the amount of steel needed in the structural members, thereby reducing overall steel cost. Similarly, shear stud connectors are also used in bridge construction to provide a secure connection of the concrete deck to the steel support structure.
Stud welding is the process of welding the shear stud connectors to the steel beams during installation of the corrugated metal floor decking (in the case of multi-story buildings) or during installation of the bridge decking (in the case of bridge construction). A typical shear stud connector consists of a steel rod approximately five inches in length and up to ¾ -inch in diameter, with a flange at one end (Figure 1). A ceramic ferrule is used to keep heat and molten material within the appropriate zone when welding a stud to the steel beam (American Society of Civil Engineers, 2002).
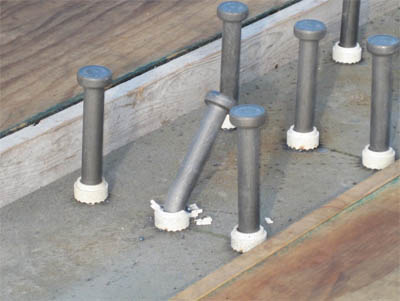 |
| Figure 1: Welded shear stud connectors with ceramic ferrules during bridge construction. |
Stud welding is a four-step arc welding operation (American Welding Society, 2004). First, a stud is loaded into an arc welding gun which is then positioned appropriately against the work surface to produce an electrical circuit. Second, the operator triggers the welding gun, sending current through stud. The welding gun will then slightly elevate the stud, creating an arc of electricity between the stud and steel, thus forming a path for the weld current. Third, after the weld current has melted both the stud tip and base steel, the gun will plunge the stud downward into the molten material. Finally, once the completed weld has cooled, the ceramic ferrule is discarded.
Exposure to Physical Risk Factors during Stud Welding
Individuals who install shear stud connectors are exposed to prolonged, extreme forward flexion of the trunk. Thus, the primary exposure may be considered a stooped work posture (Figure2a), which Holmström et al. (1992) found to be significantly associated with an elevated risk of low back pain when the duration of exposure exceeded four hours per day.
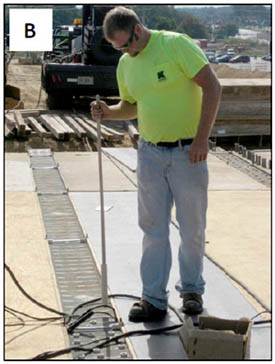
Aside from the major task of welding studs, stud welders also perform number of subtasks as part of the overall process. The ceramic ferrules must be individually set in position, and workers assume a stooped posture when placing the ferrules along the decking. Also, the electrical cables that provide the weld current must be repositioned on occasion over the course of the work day. A standard welding cable may weigh in excess of one pound per linear foot, depending on the amperage rating (Allied Wire and Cable, 2005); therefore, high shoulder forces may be required to move cable about the decking. In the case of bridge construction, each weld location is prepared with an angle grinder, further exposing the stud welders to stooped working postures (Figure 2b).
Figure 2.
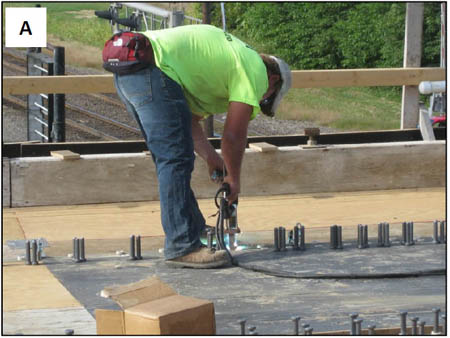 |
| A – stud welding using traditional equipment. |
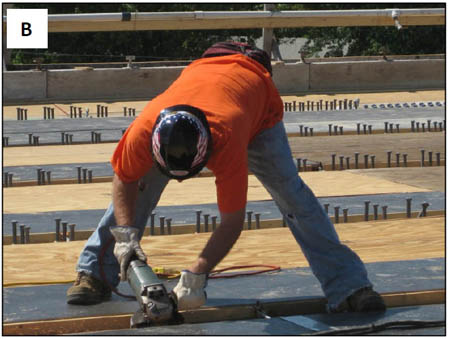 |
| B – preparing weld locations with an angle grinder. |
Intervention to Mitigate Stooping During Stud Welding
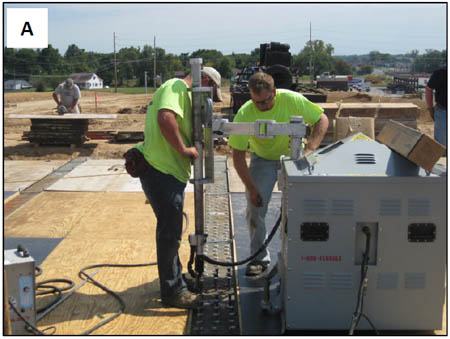
An intervention system designed to reduce exposure to stooped postures during stud welding is shown in Figure 3. The system includes a wheeled cart with an articulating arm to which standard stud welding equipment may be attached. The articulating arm allows the stud welder to maintain a more upright working posture, thus potentially reducing the mechanical load on the low back during stud welding. The cart also includes an automatic stud dispenser, eliminating the need for the welder to manually load individual studs into the weld gun. In addition to the cart, the intervention system provides a separate ferrule dispenser, which eliminates the need for the stud welder to stoop when placing ferrules.
Figure 3.
 |
| B – preparing weld locations with an angle grinder. |
 |
| B – preparing weld locations with an angle grinder. |
Exposure Assessment Methods
Methods used to estimate exposure to physical risk factors in field studies include: 1) self-report methods such as surveys or ratings of perceived exertion, 2) observational methods such as expert ratings or videotape analysis, and 3) direct measurement methods (Burdorf & van der Beek, 1999; Winkel & Mathiassen, 1994). Self-report and observational exposure assessment techniques have the advantages of low cost and ease of application, but the information obtained lacks precision and can result in misclassification of exposure in epidemiologic studies (Burdorf & van der Beek, 1999; Hansson et al., 2001; Spielholz, Silverstein, Morgan, Checkoway, & Kaufman, 2001). In addition, since not all methods apply the same criteria when estimating exposure, comparisons across studies are tenuous (Ketola, Toivonen, & Viikari-Juntura, 2001; Viikari-Juntura et al., 1996). Direct measures, such as surface electromyography (EMG) and inclinometry, produce the more precise estimates of exposure to physical risk factors (Burdorf & van der Beek, 1999; Winkel & Mathiassen, 1994).
In terms of evaluating ergonomic intervention effectiveness, a common approach is to estimate exposure to physical risk factors during a simulation of the work task conducted in a laboratory setting (e.g., Anton, Rosecrance, Gerr, Merlino, & Cook, 2005). In such studies, an observed reduction in exposure to physical risk factors during use of an intervention is generally interpreted as a reduction in MSD risk (Mathiassen, Burdorf, van der Beek, & Hansson, 2003). However, in jobs comprised of multiple tasks, the contribution of the task for which the intervention was designed to overall job exposure is rarely assessed (Winkel & Mathiassen, 1994). Many studies of industrial work have used a task-based approach for estimating overall job exposure, sampling a relatively short period of each task comprising the whole job (Svendsen, Mathiassen, & Bonde, 2005). However, exposure estimates using task-based sampling have been shown to correlate poorly with exposure estimates obtained from whole-day measurements (Svendsen et al., 2005).
Systematic, fixed-interval observation of video recordings has been suggested as a viable method to estimate whole-day exposure to physical risk factors among construction workers (Buchholz, Paquet, Punnett, Lee, & Moir, 1996; Paquet, Punnett, Woskie, & Buchholz, 2005). However, the data collection requires field staff to be in reasonable proximity to the subject, and data analysis can be labor-intensive (Paquet et al., 2005). In addition, because stud welders often work in elevated locations near open structural steel, maneuvering video equipment about the job site could lead to safety concerns for study personnel.
While practical issues such as cost, portability, data storage capacity, and an inability to withstand a rugged environment have limited the use of direct measurements in previous studies of construction work, advances in data logger technology now allow for whole-day estimation of exposure to physical risk factors. Therefore, in this study, we used whole-day recordings of surface EMG and inclinometry to 1) obtain more precise estimates of exposure than could be achieved with observation, and 2) evaluate the effectiveness of the stud welding intervention system as it relates to the whole job.
Objectives
The objectives of this study were to 1) quantify exposure to physical risk factors during stud welding in field conditions, focusing on trunk posture and muscle activity and 2) compare exposure to physical risk factors among stud welders during use of traditional equipment and during use of the intervention system. Since there is epidemiological evidence that stooped work is associated with low back pain, reduction of low back muscular and postural loads may contribute to reducing the prevalence and incidence of low back pain among stud welders.
Overall Description of Study Design
This study was a repeated-measures, field-based assessment of trunk inclination angle and activation levels of the erector spinae and upper trapezius muscle groups for the purpose of evaluating a specific intervention related to stud welding. Participants included ten journeyman ironworkers currently employed and regularly performing stud welding activities. Each participant was measured for one complete work shift. Traditional stud welding methods were used during one half of the shift and the intervention system was used during the other half of the shift. The portion of the shift in which the intervention system was used was randomized (i.e., random assignment to morning or afternoon). All participants were familiar with the intervention system prior to enrollment in the study. The independent variable was the stud welding method (traditional vs. intervention). Dependent variables included summary measures of muscle activation level, trunk inclination, and estimated spinal compression. Each dependent variable was assessed separately in the statistical procedures.
Study Sample
Study participants consisted of a convenience sample of ten healthy stud welders working the in the St. Louis, Missouri metropolitan area. The inclusion criteria were: 1) 18 to 65 years of age, 2) minimum of third-year apprentice status, 3) no history of physician-diagnosed musculoskeletal disorders in the low back or neck/shoulder regions, and 4) no medical history of orthopaedic surgery of the low back or shoulder. Each participant provided written informed consent prior to engaging in study procedures. Compensation of $100 was provided as an incentive for participation.
Measurement Overview
As mentioned, each participant was measured for one complete work shift and used each stud welding method for approximately one-half of the shift. Although our measurement hardware was capable of recording data from all sensors continuously for the shift duration, resulting in a single measurement file per day, we decided to record each hour of data collection to a separate file. Primarily, this was done to protect against data losses should the equipment malfunction after a significant amount of measurement time had passed.
Eight complete hours of measurement was the original target for each day of data collection. However, variations in equipment set-up time, job site, and weather often restricted the total measurement time to less than eight hours.
Surface EMG Methods
EMG Equipment and Setup
Myoelectric activity of the upper trapezius and thoracic erector spinae (T9 level) muscles were recorded bilaterally, and electrodes were positioned on the skin over each muscle according to standard placement guidelines (Zipp, 1982). The surface EMG electrodes had dual, bipolar, 10 x 1 mm silver bars encased in 40 x 20 x 5 mm polycarbonate blocks, an inter-electrode distance of 10 mm, on-site differential preamplification with a gain of 1000, and a 20-450 Hz bandwidth(model DE2.3, Delsys Inc., Boston, MA). At the time of recording, the skin surfaces were cleaned with alcohol, excess hair was removed with a battery-operated shaver if necessary, and double-sided hypoallergenic tape was used to secure the electrodes at the placement location. Similarly, a reference electrode was secured to the skin over the clavicle on the non-dominant side.
The electrode cables were connected to a data logger system (Myomonitor IV ®, Delsys Inc., Boston , MA), and the band-limited unprocessed EMG signals were digitized with a 1000 Hz sampling rate and recorded on a compact flash memory card. The data logger fit easily into a small pack worn about the waist and did not interfere with work activities. The logger also had a small liquid crystal display to allow real-time viewing of the EMG signals for the purpose of monitoring signal quality both during initial setup and periodically during recording.
EMG Pre-Analysis Processing
All EMG signals were processed with custom software (Fethke, Anton, Fuller, & Cook, 2004) written in LabVIEW® (National Instruments Inc., Austin, TX). The computing hardware consisted of a Dell Precision T5400 workstation with 4GB of RAM, dual Intel Xeon E5405 quad-core processors, and dual 10,000 RPM hard drives. One hard drive was used for the operating system and software installation location, the other for data storage and the location of the virtual memory page file. This computer configuration allowed for swift processing of the large data files generated in this study (e.g., ~46 MB per hour of data collection).
The unprocessed EMG signals were first visually scanned for obvious transient artifacts prior to further processing, and any identified transients were removed from the signal. Transient removal was accomplished by replacing the voltage values of the data samples associated with a transient with the mean voltage value of the entire recording period. This method was used to ensure that 1) equal numbers of samples remained for each channel of EMG data collected and 2) removing the transients would not alter the mean value of the entire EMG voltage record.
Occasionally, an electrocardiogram artifact was observed on the erector spinae myoelectric recordings. In these cases, additional high pass filtering was performed using a 4th order Butterworth digital IIR architecture with a 30 Hz corner frequency. Although the 30 Hz corner frequency resulted in some loss of EMG signal power, this method is straightforward and has been used to remove electrocardiogram contamination in previous studies without meaningful alteration of amplitude estimates (Drake & Callaghan, 2006; Redfern, Hughes, & Chaffin, 1993).
After transient inspection and electrocardiogram filtering, the mean voltage value of the unprocessed EMG files was subtracted to remove DC offset. Then, the power spectrum of each EMG file was examined to determine specific frequencies of noise contamination (if any). The power spectra were computed as follows: 1) each file was parsed into sections of 213 samples in length (approximately 8.1 seconds), 2) the last section of the recording, if unequal to 213 samples, was discarded from the analysis, 3) a Hanning window was applied to each section to reduce spectral leakage at the section endpoints, 4) a Fast Fourier Transform was used to derive power spectra for each section separately, and 5) the power spectra from the windowed sections were averaged to form an average power spectrum for the entire recording. Based on the characteristics of the averaged power spectra, digital IIR filters could then be designed to attenuate specific noise frequencies, if observed, prior to further processing.
The final step in preparing the EMG files for analysis involved digitally converting the unprocessed signals to instantaneous root-mean-square (RMS) amplitude. RMS conversion was accomplished using a 100-sample moving window, with a 50-sample overlap. The resulting RMS-processed EMG files thus had an effective sampling rate of 20 Hz.
EMG Normalization Procedures
For each muscle group, the myoelectric activity recorded during work was expressed as a percentage of the electrical activation obtained during submaximal reference contractions (%RVE). Subjects were standing for all reference contractions. For the upper trapezius, the arms were abducted to 90° in 20° horizontal adduction, with the elbow fully extended and forearm pronated, and a 2 kg weight was held in each hand (Mathiassen, Winkel, & Hägg, 1995). For the erector spinae, participants flexed forward to a trunk inclination angle of 30° from vertical and held a load with both hands and the arms hanging vertically. Two reference loads were used (62.3 N and 113.4 N); the heavier of the two loads was used as the reference to estimate summary measures expressed as %RVE, while both loads were used to develop estimates of spinal compression (described below).
Three repetitions of each submaximal reference contraction were performed, with a rest period of at least one minute between contractions to avoid fatigue. Participants maintained each submaximal reference contraction for 15 sec., and the mean RMS amplitude of the middle 10 sec. of each contraction was calculated. For each muscle separately, the average of the mean RMS EMG amplitudes from the three reference contractions was considered the RVE activation level.
The resting RMS EMG amplitude level was also measured. While the participants sat in a relaxed posture with the upper back and arms supported, EMG was recorded for 60 sec. The “resting level” was defined as the lowest mean RMS amplitude during the 60 sec. recording period. The resting level was quadratically subtracted from all subsequent RMS EMG amplitude values (Thorn et al., 2007). Following the subtraction of the resting level, the RMS voltage values during working activities were divided by the reference RMS voltage levels, providing EMG waveforms with amplitude values expressed as a percentage of the submaximal reference RMS voltage (i.e., %RVE).
Specific EMG Summary Measures
Mean RMS Amplitude. The arithmetic mean of the normalized RMS EMG amplitude (in %RVE) was calculated.
Peak, Median, and Static EMG Levels. The peak, median, and static EMG levels for each muscle were determined by calculating amplitude probability distribution functions (APDF) from the normalized RMS EMG waveforms (Jonsson, 1982). The normalized RMS EMG value associated with the 90th percentile of the APDF was considered the peak EMG level, the value associated with the 50th percentile of the APDF was considered the median EMG level, and the value associated with the 10th percentile of the APDF was considered the static EMG level.
EMG Gap Frequency and Percent Time at Rest. EMG gap analysis provides two summary measures; gap frequency is the average number of gaps per minute within the analysis period, and percent rest is the summed duration of all identified gaps divided by the total time in the analysis period (Veiersted, Westgaard, & Andersen, 1990). In this study, an EMG gap was defined for the upper trapezius muscles as a period of normalized muscle activity below 5% RVE for at least 0.25 sec. For the erector spinae muscles, the threshold amplitude used to define an EMG gap was specified individually for each participant as the %RVE required to maintain an upright standing posture.
Inclinometry Methods
Inclinometry Equipment and Setup
The angles of postural inclination in the flexion/extension and lateral bending planes relative to vertical were estimated with a triaxial piezoresistive MEMS accelerometer (model ADXL330, Analog Devices, Norwood, MA). For the purposes of this study, inclination angle in the flexion/extension plane was defined as trunk inclination angle, and inclination in the lateral bending plane was defined as lateral inclination angle. The accelerometer had a range of ±3g, a sensitivity of 250 mV/g (based on a 2.5 VDC supply), and was configured for a bandwidth of 0 – 50 Hz. The accelerometer was encased in a 40 x 20 x 5 mm polycarbonate block and secured to the skin just below the sternal notch using double-sided hypoallergenic tape. The accelerometer cable was connected to a data logger system (Myomonitor IV ®, Delsys Inc., Boston, MA), and the unprocessed acceleration signals were digitized at 1000 Hz and recorded on a compact flash memory card.
Inclinometer Pre-Analysis Processing
The unprocessed acceleration signals were first low pass filtered using a 4th order Butterworth digital IIR architecture with a 5 Hz corner frequency to remove high frequency components unrelated to postural excursions. The filtered signals were then additionally smoothed using a 100 sample moving average window with a 50 sample overlap. The resulting acceleration files thus had an effective sampling rate of 20 Hz. Along with the smoothing, the moving average process also maintained a sample-to-sample temporal relationship between the inclination and RMS-processed EMG signals.
Inclinometer Calibration
Once the accelerometer was secured to the skin, trunk and lateral inclination offset voltages were obtained by having each participant stand upright in a comfortable posture for 15 seconds. The accelerometer offset voltages associated with the upright standing posture were subsequently subtracted from the accelerometer voltages measured during work activities prior to converting to inclination angles. Postural inclination angles were computed as an arccosine of the ratio of the offset-adjusted sensor acceleration to gravitational acceleration.
Specific Inclinometry Summary Measures
Mean Inclination Angle. The arithmetic means of the trunk inclination, lateral inclination, and the absolute value of the lateral inclination angles were calculated.
Peak, Median, and Static Inclination Angles. The peak, median, and static inclination angles were determined by calculating amplitude probability distribution functions (APDF) from the trunk inclination, lateral inclination, and absolute value of the lateral inclination waveforms. The inclination value associated with the 90th percentile of the APDF was considered the peak inclination level, the value associated with the 50th percentile of the APDF was considered the median inclination level, and the value associated with the 10th percentile of the APDF was considered the static inclination level.
Exposure Variation Analysis. Exposure variation analysis (EVA) was used to simultaneously describe the level and duration of trunk inclination and lateral inclination angles. While originally developed for EMG measurement (Mathiassen & Winkel, 1991), EVA has been used to assess inclinometer and electrogoniometer measures in previous studies (Hägg, Oster, & Byström, 1997; Jansen, Burdorf, & Steyerberg, 2001). EVA partitions the inclination waveform into a series of amplitude levels, and then computes the number of consecutive samples within each amplitude level, thus creating an exposure matrix. The value in each matrix cell represents the percent of work time spent in particular combinations of inclination and duration.
For each participant, the EVA matrix of trunk inclination angle was reduced to three categories for the purposes of statistical comparisons: 1) percent of work time spent in 30° or less of trunk inclination, 2) percent of work time spent in 30-60° of trunk inclination, and 3) percent of work time spent in >60° of trunk inclination. The EVA matrix of the absolute value of lateral inclination angle was reduced to the following categories: 1) percent of work time spent in 15° or less of lateral inclination, 2) percent of work time in 15-30° of lateral inclination, and 3) percent of work time in >30° of lateral inclination.
In addition, the EVA profiles from each participant were used to compute an average EVA matrix for each stud welding method and for each inclination plane in order to make qualitative comparisons between the methods.
Compression Normalized EMG (CNEMG) Methods
A procedure reported by Mientjes et al. (1999) was modified and used to transform the RMS-processed EMG waveforms from the erector spinae muscles into estimated spinal compression. The height and weight of each participant was entered into computerized biomechanical model (3DSSPP, University of Michigan, Ann Arbor, MI). The posture of the digital mannequin was adjusted to match the posture assumed in the erector spinae EMG normalization procedure. The weight applied at the mannequin’s hands was set to either 63.2 N or 113.4 N, depending on the normalization trial, and the estimated compression at the L4/L5 disc was noted from the model output. Similarly, the L4/L5 compression with the mannequin standing in an upright posture with no load at the hands was also estimated from the model. An EMG-to-compression calibration was then developed by creating a scatter plot with the estimated compression on the Y-axis and the sum of the left and right erector spinae RMS-processed EMG on the X-axis. A linear relationship between the total erector spinae RMS amplitude and spinal compression was assumed (Village et al., 2005).
Specific CNEMG Summary Measures
Mean Compression. The arithmetic mean of the CNEMG waveform (in kN) was calculated.
Peak, Median, and Static CNEMG. The peak, median, and static CNEMG levels were determined by calculating amplitude probability distribution functions (APDF) from the CNEMG waveforms. The CNEMG value associated with the 90th percentile of the APDF was considered the peak CNEMG level, the value associated with the 50th percentile of the APDF was considered the median CNEMG level, and the value associated with the 10th percentile of the APDF was considered the static CNEMG level.
Percent of Work Time in Various Compression Categories. An exposure variation analysis was performed on the CNEMG waveforms to the compute the percentage of work time spent below 3,400 N of L4/L5 of compression, between 3,400 N and 6,500 N of compression, and above 6,500 N of compression. These compression categories were selected to reflect the NIOSH action and maximum permissible limits for spinal compression (NIOSH, 1981).
Rate of L4/L5 Compression. Due to differences in the time each participant spent using the traditional equipment and the intervention system, direct comparisons of cumulative compression could not be performed. Instead, the cumulative compression was divided by the total work time for each system to arrive at a compression rate, in kN per minute.
Statistical Analyses
All statistical analyses were conducted with SAS, version 9.2 (SAS Institute, Cary, NC). Each summary measure was described with descriptive statistics (e.g., mean, sd) by stud welding method. Paired t-tests (twotailed) were used to compare the summary measure means between the stud welding methods.
Participant Characteristics
Table 1 presents demographic characteristics of the ten study participants. All participants were male, journeyman inronworkers, right-handed, and had been employed with the current employer for a minimum of three years at enrollment.
Table 1. Participant demographics (N=10).
| Demographic Variable | Median (Range) |
| Age (yrs) | 32 (24 – 44) |
| Height (m) | 1.80 (1.68 – 1.85) |
| Body Mass (kg) | 91.8 (63.5 – 99.3) |
| Body Mass Index (kg/m2) | 27.8 (22.6 – 34.3) |
| Years with current | 9.5 (3.0 – 16.0) |
| employer |
Sampling Duration
Exposure data were recorded across stud welding methods for an average of 5.3 hours (sd = 1.4 hours) per participant. The mean total sampling duration per participant was longer for the traditional equipment (3.7 ± 1.6 hours) than for the intervention system (2.2 ± 1.3 hours).
EMG Data Quality
Transient Artifacts
Both the upper trapezius and erector spinae EMG recordings were largely unaffected by transient artifacts. On average, a mean of 5.34 seconds of unprocessed EMG was replaced with the mean voltage value per muscle (range: 0 – 36.4 sec). As a percentage of the total sampling time the transients represented, on average, 0.03% of the original EMG information. No difference in the number or duration of transients was observed between the stud welding methods.
Noise Contamination
Frequency analysis of the unprocessed upper trapezius and erector spinae EMG files, following the removal of transients (all 10 participants) and filtering of the electrocardiogram (six of 10 participants), revealed no issues with noise contamination at specific frequencies (e.g., 60 Hz and harmonics). Therefore, additional filtering was not required prior to digital RMS processing and computation of summary measures.
Exclusion of Erector Spinae EMG
Although the signal quality of all upper trapezius EMG recordings was deemed acceptable, the left and right erector spinae EMG recordings were excluded from the analysis for two of the 10 participants. For each of the two participants, losses in the integrity of the skin-to-electrode interfaces were apparent after approximately two hours of sampling time. Ambient temperatures exceeding 85° F likely caused excess sweat collection in the area of the electrode placement, which subsequently saturated the tape holding the electrodes in position and lead to unstable connections.
Trunk Inclination Angles
Descriptive statistics and the results of the paired t-tests related to trunk inclination angle summary measures are provided in Table 2. In general, the intervention system resulted in substantial improvements to trunk posture as compared to the traditional equipment. For example, mean trunk inclination angle was reduced from 34.4° (sd = 10.4°) during use of the traditional equipment to 9.7° (sd = 7.0°) during use of the intervention system (p < 0.01). Peak trunk inclination angle, computed as the 90th percentile of the trunk inclination APDF, was reduced from a mean of 81.7° (sd = 6.4°) during use of the traditional equipment to a mean of 34.6° (sd = 18.6°) during use of the intervention system (p < 0.01). In addition, the percentage of work time spent in trunk inclination angles of greater than 60° was reduced from a mean of 40.0% (sd = 10.1%) during use of the traditional equipment to a mean of 4.7% (sd = 5.7%) during use of the intervention system (p < 0.01).
Table 2: Mean (sd) of trunk inclination and lateral inclinations summary measures by stud welding method, and paired t-test results.
| Exposure Variable | Traditional | Intervention | p-value1 |
| Trunk Inclination Angle2 | |||
| Mean (°) | 34.4 (10.4) | 9.7 (7.0) | <0.01 |
| APDF 10th (°) | -9.0 (4.7) | -10.1 (2.8) | 0.26 |
| APDF 50th (°) | 30.6 (28.6) | 4.9 (7.0) | 0.02 |
| APDF 90th (°) | 81.7 (6.4) | 34.6 (18.6) | <0.01 |
| ≤ 30° (% time) | 52.6 (12.9) | 85.8 (11.3) | <0.01 |
| 30-60° (% time) | 7.4 (5.9) | 9.6 (10.1) | 0.60 |
| >60° (% time) | 40.0 (10.1) | 4.7 (5.7) | <0.01 |
| Lateral Inclination Angle3 | |||
| Mean (°) | 1.3 (3.8) | -3.0 (3.7) | 0.03 |
| APDF 10th (°) | -13.2 (4.6) | -15.0 (5.2) | 0.42 |
| APDF 50th (°) | 0.7 (4.0) | -4.4 (4.3) | 0.03 |
| APDF 90th (°) | 18.8 (7.0) | 10.5 (3.5) | 0.02 |
| Absolute Value of Lateral | |||
| Inclination Angle | |||
| Mean (°) | 10.6 (2.4) | 9.4 (2.6) | 0.31 |
| APDF 10th (°) | 1.5 (0.4) | 1.5 (0.7) | 0.89 |
| APDF 50th (°) | 8.1 (2.0) | 8.0 (3.4) | 0.93 |
| APDF 90th (°) | 22.9 (5.4) | 18.3 (3.9) | 0.06 |
| ≤ 15° (% time) | 76.2 (10.1) | 79.9 (13.8) | 0.50 |
| 15-30° (% time) | 18.7 (6.8) | 17.7 (13.5) | 0.84 |
| >30° (% time) | 5.1 (3.5) | 2.4 (0.9) | 0.04 |
| 1 P-values obtained from paired t-tests for N=10 participants | |||
| 2 Negative values = rearward inclination; positive values = forward inclination | |||
| 3 Negative values = left lateral inclination; positive values = right lateral inclination> | |||
Figure 4 shows histograms as a visual reference for the difference in trunk inclination angles between the traditional equipment and the intervention system. The data shown are from one participant and one hour of data collection for each stud welding method. During use of the traditional equipment, the histogram of trunk inclination angle is bimodal in appearance, with one large concentration of inclination angles centered near 0° and a second concentration centered near 80°. Thus, stud welders are either standing upright or assume a fully stooped posture while working, with little variation. During use of the intervention system, the inclination concentration near 80° is essentially shifted to near 30°. This indicates that while the intervention system minimizes exposure to stooped postures, some forward inclination is still required for operation.
Figure 4: Trunk inclination angle histograms from one participant over one hour of data collection with each stud welding method.
As expected, the EVA of trunk inclination angles, averaged across participants for each stud welding method, reflected the results of the APDF analyses. However, the EVA also revealed information concerning the duration for which different trunk inclination angles were maintained during use of the traditional equipment and intervention systems. Of primary interest was the duration of sustained trunk inclination angles exceeding 60°. Across participants, the traditional equipment resulted in trunk inclination angles greater than 60° for at least 10 continuous seconds for 29.2% of work time (sd = 12.9%). In contrast, the intervention system resulted in trunk inclination angles greater than 60° for at least 10 continuous seconds for 2.6% of work time (sd = 4.7%). Although explicit statistical analyses were not performed, the intervention system appears to reduce exposure to sustained trunk inclination angles exceeding 60°.
Lateral Inclination Angles
Descriptive statistics and the results of the paired t-tests related to lateral inclination angle summary measures are provided in Table 2. No difference in the 10th percentile of the lateral inclination APDF was observed between the traditional equipment and the intervention system. However, the other lateral inclination summary measures (mean, 50th percentile of the APDF, and 90th percentile of the APDF) indicated that the intervention system resulted in a shift in lateral inclination angle toward the left side compared to the traditional equipment.
The 90th percentile of the APDF of the absolute value of lateral inclination angle was reduced from 22.9° (sd = 5.4°) during use of the traditional equipment to 18.3° (sd = 3.4°) during use of the intervention system, although this difference was not statistically significant (p = 0.06). The percentage of work time spent with an absolute value of lateral inclination angle exceeding 30° was reduced from 5.1% (sd = 3.5%) during use of the traditional equipment to 2.4% (sd = 0.9%) during use of the intervention system (p = 0.04).
Upper Trapezius EMG
Descriptive statistics and the results of the paired t-tests related to upper trapezius EMG summary measures are provided in Table 3. In general, the intervention system resulted in less desirable estimates of both left and right upper trapezius muscle activity than the traditional equipment.
For the left upper trapezius, the mean RMS activity increased from 16.0% RVE (sd = 6.5% RVE) during use of traditional equipment to 22.0 %RVE (sd = 10.7 %RVE) during use of the intervention system (p = 0.01), the static EMG level increased from 1.2 %RVE (sd = 0.6 %RVE) to 1.9 %RVE (sd = 1.2%) (p = 0.04), the median EMG level increased from 6.8 %RVE (sd = 5.4 %RVE) to 13.6 %RVE (sd = 10.4 %RVE) (p = 0.02), and the percentage of work time with the muscle at rest decreased from 46.2% (sd = 15.6%) to 23.6% (sd = 15.4%) (p < 0.01). In addition, the peak EMG level increased and the number of EMG gaps per minute decreased during use of the intervention system, although these differences were not statistically significant.
For the right upper trapezius, the mean RMS activity increased from 19.7% RVE (sd = 8.1% RVE) during use of traditional equipment to 25.4 %RVE (sd = 10.3 %RVE) during use of the intervention system (p = 0.02), the number of EMG gaps per minute decreased from 17.1 (sd = 4.6) to 13.6 (sd = 3.7) (p = 0.03), and the percentage of work time with the muscle at rest decreased from 39.5% (sd = 14.8%) to 29.0% (sd = 11.3%) (p < 0.01). In addition, the static, median, and peak EMG levels all increased during use of the intervention system, although these differences were not statistically significant.
Erector Spinae EMG
Descriptive statistics and the results of the paired t-tests related to erector spinae EMG summary measures are provided in Table 3. In general, no statistically significant differences were observed in either the left or right erector spinae between the traditional equipment and the intervention system. For the right erector spinae, however, the number of EMG gaps per minute decreased from 18.8 (sd = 7.1) during use of traditional equipment to 12.1 (sd = 2.0) during use of the intervention system (p = 0.03), and the percentage of work time with muscle activity below the levels needed to maintain an upright standing posture decreased from 22.2 % (sd = 10.9) to 14.2% (sd = 5.1%) (p = 0.02).
Compression Normalized EMG
Descriptive statistics and the results of the paired t-tests related to CNEMG summary measures are provided in Table 3. No statistically significant differences were observed between the traditional equipment and the intervention system in terms of estimated spinal compression.
Table 3: Mean (sd) of EMG and CNEMG summary measures by stud welding method, and paired t-test results.
| Exposure Variable | Traditional | Intervention | p-value1 |
| Left Upper Trapezius EMG (N=10) | |||
| Mean RMS (%RVE) | 16.0 (6.5) | 22.0 (10.7) | 0.01 |
| APDF 10th (%RVE) | 1.2 (0.6) | 1.9 (1.2) | 0.04 |
| APDF 50th (%RVE) | 6.8 (5.4) | 13.6 (10.4) | 0.02 |
| APDF 90th (%RVE) | 43.1 (15.2) | 49.5 (27.0) | 0.26 |
| Gaps2 (#/min) | 17.8 (7.9) | 13.6 (5.1) | 0.18 |
| Rest3 (%time) | 46.2 (15.6) | 23.6 (15.4) | <0.01 |
| Right Upper Trapezius EMG (N=10) | |||
| Mean RMS (%RVE) | 19.7 (8.1) | 25.4 (10.3) | 0.02 |
| APDF 10th (%RVE) | 1.3 (0.7) | 1.5 (0.9) | 0.45 |
| APDF 50th (%RVE) | 9.3 (8.1) | 15.0 (11.1) | 0.09 |
| APDF 90th (%RVE) | 54.1 (23.3) | 59.9 (20.5) | 0.39 |
| Gaps2 (#/min) | 17.1 (4.6) | 13.6 (3.7) | 0.03 |
| Rest3 (%time) | 39.5 (14.8) | 29.0 (11.3) | <0.01 |
| Left Erector Spinae EMG (N=8) | |||
| Mean RMS (%RVE) | 64.3 (18.9) | 68.7 (22.0) | 0.47 |
| APDF 10th (%RVE) | 15.2 (3.6) | 14.1 (3.6) | 0.18 |
| APDF 50th (%RVE) | 41.9 (11.9) | 46.6 (11.0) | 0.31 |
| APDF 90th (%RVE) | 136.8 (49.0) | 150.5 (69.3) | 0.45 |
| Gaps4 (#/min) | 21.2 (8.3) | 18.9 (6.3) | 0.49 |
| Rest3 (%time) | 23.5 (16.1) | 23.0 (8.9) | 0.88 |
| Right Erector Spinae EMG (N=8) | |||
| Mean RMS (%RVE) | 75.1 (41.8) | 71.1 (27.9) | 0.57 |
| APDF 10th (%RVE) | 13.1 (5.3) | 14.5 (4.4) | 0.15 |
| APDF 50th (%RVE) | 46.7 (24.9) | 50.5 (18.2) | 0.43 |
| APDF 90th (%RVE) | 165.7 (99.8) | 147.9 (70.3) | 0.32 |
| Gaps4 (#/min) | 18.8 (7.1) | 12.1 (2.0) | 0.03 |
| Rest3 (%time) | 22.2 (10.9) | 14.2 (5.1) | 0.02 |
| Estimated L4/L5 Compression (N=8) | |||
| Mean (kN) | 1.55 (0.48) | 1.59 (0.43) | 0.71 |
| APDF 10th (kN) | 0.50 (0.25) | 0.52 (0.24) | 0.30 |
| APDF 50th (kN) | 1.15 (0.39) | 1.25 (0.31) | 0.33 |
| APDF 90th (kN) | 3.02 (1.11) | 3.02 (1.16) | 0.99 |
| ≤ 3.4 kN (% time) | 91.1 (6.9) | 91.5 (7.2) | 0.80 |
| >3.4-6.5 kN (% time) | 7.5 (5.7) | 7.3 (5.9) | 0.88 |
| >6.5 kN (% time) | 1.3(1.7) | 1.2 (1.7) | 0.29 |
| Compression Rate5 (kN/min) | 93.3 (29.0) | 95.3 (26.1) | 0.71 |
| 1 P-values obtained from paired t-tests | |||
| 2 EMG gap (upper trapezius) = period of muscle activity below 5 %RVE for at least 0.25 second | |||
| 3 EMG rest defined as the summed duration of all identified EMG gaps divided by signal time | |||
| 4 EMG gap (erector spinae) = period of muscle activity 1) below the %RVE required to maintain upright standing posture 2) for at least 0.25 second | |||
| 5 Compression rate defined as the cumulative compression divided by time | |||
Trunk Inclination Angle
Epidemiologic evidence suggests that long-term exposure to the trunk inclination exposure pattern observed in this study can lead to an elevated risk of LBP among stud welders using traditional equipment. Punnett et al. (1991) observed, in a case-control study, a positive association between the percentage of work time spent in trunk flexion angles exceeding 20° and the risk of LBP. When considering trunk flexion angles greater than 45°, the risk of LBP was further elevated. Similarly, Jansen et al. (2004) reported an increased risk of disabling LBP incidence among nursing home workers when trunk flexion exceeded 45° for more than ninety minutes per week during one year of prospective observation. In another case-control study, Seidler et al. (2001) examined the associations between physical risk factors and several specific low back musculoskeletal diagnoses in a case-control study. The cumulative number of hours spent in extreme trunk flexion (> 90°) prior to diagnoses was associated with LBP-related outcomes among patients with a variety of occupational backgrounds.
In this study, we observed significant improvements in the magnitude and duration of exposure to forward trunk inclination during use of the intervention system. The intervention system reduced the both the mean and peak angles of trunk inclination, reduced the overall percentage of work time with trunk inclination angles of greater than 60°, and reduced the percentage of work time with sustained (i.e., > 10 seconds) trunk inclination angles of greater than 60°.
Muscle Activity
While the intervention system clearly improved the trunk inclination angle, similar improvements in EMG summary measures were not observed. In particular, the system resulted in less desirable upper trapezius muscle activation profiles. Generally, the left and right upper trapezius muscles experienced 1) higher amplitudes of activation and 2) decreased duration of rest while using the intervention system.
Two interacting factors likely contributed to the observed results. First, during use of the traditional equipment, the upper body weight was fully supported on the welding gun while in the welding position. This action secured the welding gun, loaded with a shear stud connector, over the weld location without the application of large forces from the shoulder musculature. Figure 5 illustrates this response, with low levels of upper trapezius activity (< 5% RVE) throughout the welding activity.
Second, during use of the intervention system, the stud welder must 1) manipulate the articulating arm into position over the stud catcher on the cart, 2) apply downward pressure to load the stud into the chuck of the welding hardware, 3) manipulate the arm into the welding position, and 4) apply downward pressure to maintain the position of the stud over the weld location prior to activating the weld current. The forces needed to manipulate the articulating arm and apply downward pressure are acting at various horizontal distances from the shoulder joint, resulting in external shoulder joint moments and increased upper trapezius contraction levels for shoulder joint stabilization (Figure 6).
Figures 5 also demonstrates that although trunk inclination angles during use of the traditional equipment were sufficient to elicit the flexion-relaxation response in the lumbar erector spinae (Solomonow, Baratta, Banks, Freudenberger, & Zhou, 2003), the thoracic erector spinae remained active. Therefore, the decision to place the electrodes at T9 appeared to minimize the effect of the flexion-relaxation response in our analyses. During use of the traditional equipment, a cessation of erector spinae activity was evident during the welding action (e.g., Figure 5, region B » C) as the upper body weight was fully supported on the welding gun, followed by a period of activity as the welding gun was loaded and repositioned over the next weld location (e.g., Figure 5, region C » D). Similar to the upper trapezius response, the erector spinae activity observed during use of the intervention system (Figure 6) was caused by the increased external bending moments during manipulation of the articulating arm.
Figure 5: Trunk inclination angle, left erector spinae (ES) EMG, and left upper trapezius (UT) EMG collected during use of the traditional equipment. A » B: moving to next row and loading first stud; B » C: welding first stud; C » D: loading second stud; D » E: welding second stud; E » F: loading third stud; F » G: welding third stud.
Figure 6: Trunk inclination angle, left erector spinae (ES) EMG, and left upper trapezius (UT) EMG collected during use of the intervention system. A » B: loading first stud in row; B » C: welding first stud; C » D: loading second stud; D » E: welding second stud; E » F: loading third stud; F » G: welding third stud.
The observed reduction in the percentage of work time with muscle activity below the levels needed to maintain an upright standing posture for the right erector spinae during use of the intervention system was a function of posture. Participants tended to lean slightly to the left in order view the work surface when manipulating the articulating arm into the welding position. The negative values associated with the mean and median lateral inclination angle also indicate that left lateral inclination was more common during use of the intervention system than right lateral inclination. Subsequently, the right erector spinae, although not contracting at increased amplitude levels, was contracting more steadily to maintain posture during use of the intervention system.
Estimated Spinal Compression
We did not observe meaningful differences between the stud welding methods in the summary measures of estimated L4/L5 compression. This is a somewhat surprising result since, with all other factors constant (e.g., anthropometry, load at the hands, etc.), spinal compression force increases with greater trunk flexion. There are several plausible explanations. First, the external moments imposed upon the L4/L5 during use of the intervention system may have resulted in erector spinae activity levels similar to the levels observed when in the welding position with the traditional equipment. The absence of observed significant differences in the mean RMS erector spinae amplitude between the two stud welding methods supports this possibility.
Second, the relationship between erector spinae EMG activation levels and spinal compression may not be linear across the range of trunk postures observed in this study. Nonlinear relationships between EMG activation levels and muscle tension measures are common in many muscle groups, especially when considering a wide range of forces, postures, and dynamic activities (Cram & Kasman, 1998). In addition, the relationship between EMG activation and spinal compression may not be linear, and the linear EMG-tocompression calibration technique used to derive the CNEMG waveforms may have resulted in erroneous estimates of spinal compression. A more robust calibration would use a range of postures, hand loads, and anthropometric measures as inputs into the biomechanical modeling software. However, because we were sampling data on active job sites, increasing the complexity and time requirements of our normalization and calibration procedures was not considered feasible.
Selecting T9 as the spinal level for electrode placement location (versus the lumbar region) minimized the effect of the flexion-relaxation phenomenon in the sampled erector spinae EMG waveforms. However, the correlation between erector spinae activation levels at T9 and activation levels in the lumbar region was not assessed. If the correlation was weak, then our estimates of spinal compression may not accurately reflect the biomechanical loads imposed on lumbar region.
Finally, the summary measures presented in this study, including those related to estimated spinal compression, reflect job-level and not task-specific exposures. Restricting the analysis to periods of active welding time could accentuate the differences between the traditional equipment and the intervention system.
Productivity
Although not formally evaluated, we did observe participants’ productivity while using each stud welding method. When considering strictly the welding activity, the cycle time during use of the traditional equipment ranged between three and eight seconds per weld, depending on participant. During use of the intervention system, the cycle time increased to a range between eleven and eighteen seconds per weld. Production rates when considering welding and all supporting tasks (e.g., grinding, dispensing ferrules, moving welding equipment, etc.) and breaks were also generally reduced during use of the intervention system (~ 250 welds per hour) versus the traditional equipment (~350 welds per hour). Caution is warranted when interpreting the productivity figures, however. Since participants were familiar with the intervention system, they may also have
been aware of the reduced production capabilities and subsequently increased the welding rate during use of the traditional equipment in order to compensate and ensure timely job completion.
Limitations
There were several limitations to this study. The trunk inclination and lateral inclination angles reflect the spatial orientation of the accelerometer, adjusted for a neutral reference posture, and are not direct measures of trunk posture in the flexion/extension and lateral bending planes. The unprocessed acceleration signals were low pass filtered and smoothed to minimize errors in the estimation of the trunk and lateral inclination angles resulting from higher frequency acceleration components unrelated to posture. In working environments with dynamic motion, the output acceleration is the result of a combination of different acceleration types (translational, vibrational, and rotational). However, previous studies have reported minimal error associated with the use of accelerometers in estimating inclination angles in dynamic settings, especially during slower movements (Miller & Fathallah, 2007; Paquet, Punnett, & Buchholz, 2001; Wong, Lee, & Yeung, 2009). Other aspects of trunk motion (e.g., axial rotation and movement velocity) may also contribute the risk of developing LBP but were not assessed in this study (Marras et al., 1995).
Although a sample size of 10 stud welders was sufficient to detect differences in several EMG and inclination summary measures using the repeated-measures design, we were not able to include other variables in the analyses. The effect of the intervention system on trunk inclination and muscle activation during stud welding may depend partly on the anthropometric characteristics of the stud welder. For example, participants with shorter arm lengths might experience higher levels of upper trapezius activity when manipulating the articulating arm of the intervention system than participants with longer arms. Along with the small sample size, the non-random selection of participants limits our ability to generalize the observed results to the larger population of stud welders.
Finally, the data included in our analyses were collected during bridge construction only. The effect of the intervention system on trunk inclination and muscle activity may be different during commercial building construction. In bridge construction, the welding occurs along each structural member in an essentially linear manner, with each row of three studs spaced approximately eight to ten inches apart along the beams (Figures 2 and 3). In buildings, the studs are welded through the corrugated metal decking in an area pattern, and the welders using traditional equipment may have more opportunity to return to an upright posture between welds.
CONCLUSIONS, RECOMMENDATIONS, AND FUTURE RESEARCH
Construction workers, including ironworkers, experience an increased prevalence of low back pain when compared to workers across industry sectors. The primary objective of this study was to evaluate the potential of an intervention system designed to reduce exposure to extreme trunk flexion among ironworkers performing stud welding during the construction of bridges and multi-story commercial buildings. The results suggest that the intervention system is effective in reducing both the magnitude of trunk inclination and the percentage of work time spent in trunk inclination angles exceeding 60°. However, the intervention system appears to result in less desirable estimates of upper trapezius muscle activation levels. The observed results should be interpreted with caution in light of the small sample size and non-random selection of study participants.
Further development and study of the intervention system is recommended. Possible design enhancements should focus on 1) minimizing the forces required to operate the articulating arm and 2) increasing the production capability to encourage adoption of the system among workers in the trade. The manufacturer of the intervention system is currently developing or has developed a number of features that may reduce operating forces. For example, improved bearing surfaces have been developed that may reduce frictional forces resisting the sliding motion of the articulating arm as a new stud is loaded into the welding hardware and then moved to the welding position. Also under consideration are a reduction in the spring force of the chuck that holds the studs to minimize the downward pressure required to load a new stud within the welding hardware and the development of an electromagnetic chuck. Improvements are also being investigated to improve the operator’s view of the welding hardware to reduce the time needed to load a new stud and move the articulating arm into the welding position, subsequently improving the system’s production speed. Additional investigation into the performance of the intervention system in building construction applications and among a larger sample of stud welders is also recommended.
A potential, secondary benefit of the intervention system is a reduction in the concentration of welding fume within the worker’s breathing zone when compared to the traditional equipment. Adverse health effects associated with exposure to welding fume include respiratory illnesses such as asthma, bronchitis, and a possible increased risk of lung cancer (NIOSH, 2003). Future research concerning the stud welding intervention system should therefore include an industrial hygiene component to assess exposure to welding fume.
The most likely source of additional funding for continued research is NIOSH. The National Occupational Research Agenda outlines the NIOSH research structure, and is organized as a series of industry-specific goals and objectives. In the National Construction Agenda, reducing exposure to both welding fume and physical risk factors for musculoskeletal disorders are included prominently among the strategic goals. Thus, the intervention system, if effective, has the potential to address multiple occupational health hazards important in the construction industry.
LIST OF PRESENTATIONS AND PUBLICATIONS
Presentations
- Fethke, N. Surface electromyography in ergonomics exposure assessment: implications and applications in construction. Virginia Tech Center for Innovation in Construction Safety and Health. Blacksburg, VA. April 30, 2008.
Invited seminar to faculty and students in the Department of Industrial and Systems Engineering at Virginia Tech. Study objectives and exposure assessment strategy were discussed.
- Fethke, N. Ergonomics in Occupational and Environmental Health. University of Iowa Department of Biomedical Engineering. Iowa City, IA. February 22, 2010.
Invited seminar to faculty and students in the Department of Biomedical Engineering at the University of Iowa. Study objectives, methods, and preliminary results were discussed.
- Fethke, N. Ergonomics in the College of Public Health. University of Iowa, College of Public Health, External Advisory Board Meeting. Iowa City, IA. April 27, 2010.
Invited seminar to the University of Iowa College of Public Health external advisory board. Study objectives, methods, and results were discussed.
Publications
1. Fethke NB, Gant LC, Gerr F. Evaluation of an intervention to reduce trunk flexion among stud welders. Applied Ergonomics. In review.
Albers, J. T., & Hudock, S. D. (2007). Biomechanical assessment of three rebar tying techniques. Int.J.Occup.Saf.Ergon., 13(3), 279-289.
Allied Wire and Cable. (2005). Welding Cable. Retrieved 11/01, 2007, from http://www.awcwire.com/ProductSpec.aspx?id=Welding-Cable
American Society of Civil Engineers. (2002). Construction considerations for composite steel-and-concrete floor systems. J.Struct.Eng., 128(9), 1099-1110.
American Welding Society. (2004). Structural Welding Code - Section 7: Stud Welding No. D1.1-98). Miami, FL: ANSI/AWS.
Anton, D., Rosecrance, J. C., Gerr, F., Merlino, L. A., & Cook, T. M. (2005). Effect of concrete block weight and wall height on electromyographic activity and heart rate of masons. Ergonomics, 48(10), 1314-1330.
Bernard, B. P. (1997). Musculoskeletal Disorders and Workplace Factors: A critical review of epidemiologic evidence for work-related disorders of the neck, upper extremity, and low back. No. DHHS (NIOSH) Publication No. 97-141). Cincinatti, OH: US Department of Health and Human Services (DHHS), Public Health Service, Centers for Disease Control and Prevention, National Institute for Occupational Safety and Health (NIOSH).
Buchholz, B., Paquet, V., Punnett, L., Lee, D., & Moir, S. (1996). PATH: a work sampling-based approach to ergonomic job analysis for construction and other non-repetitive work. Appl.Ergon., 27(3), 177-187.
Buchholz, B., Paquet, V., Wellman, H., & Forde, M. (2003). Quantification of ergonomic hazards for ironworkers performing concrete reinforcement tasks during heavy highway construction. AIHA J., 64(2), 243-250.
Burdorf, A., & Sorock, G. (1997). Positive and negative evidence of risk factors for back disorders. Scand.J.Work Environ.Health, 23(4), 243-256.
Burdorf, A., & van der Beek, A. (1999). Exposure assessment strategies for work-related risk factors for musculoskeletal disorders. Scand.J.Work Environ.Health, 25 Suppl 4, 25-30.
Courtney, T. K., Matz, S., & Webster, B. S. (2002). Disabling occupational injury in the US construction industry, 1996. J.Occup.Environ.Med., 44(12), 1161-1168.
Cram, J. R., & Kasman, G. S. (1998). Introduction to Surface Electromyography. Gaithersburg, MD: Aspen Publishers.
Dababneh, A. J., & Waters, T. R. (2000). Ergonomics of rebar tying. App.Occup.Environ.Hyg., 15(10), 721-727.
Drake, J. D., & Callaghan, J. P. (2006). Elimination of electrocardiogram contamination from electromyogram signals: An evaluation of currently used removal techniques. J.Electro.Kinesiol., 16(2), 175-187.
Elders, L. A., & Burdorf, A. (2004). Prevalence, incidence, and recurrence of low back pain in scaffolders during a 3-year follow-up study. Spine, 29(6), E101-E106.
Fethke, N., Anton, D., Fuller, H., & Cook, T. (2004). A versatile program for the analysis of electromyographic data. Proceedings of the 48th Annual Human Factors and Ergonomics Society Conference, New Orleans, LA, United States. 2099-2103.
Forde, M. S., Punnett, L., & Wegman, D. H. (2005). Prevalence of musculoskeletal disorders in union ironworkers. J.Occup.Environ.Hyg., 2(4), 203-212.
Goldsheyder, D., Nordin, M., Weiner, S. S., & Hiebert, R. (2002). Musculoskeletal symptom survey among mason tenders. Am.J.Ind.Med., 42(5), 384-396.
Goldsheyder, D., Weiner, S. S., Nordin, M., & Hiebert, R. (2004). Musculoskeletal symptom survey among cement and concrete workers. Work, 23(2), 111-121.
Hägg, G. M., Oster, J., & Byström, S. (1997). Forearm muscular load and wrist angle among automobile assembly line workers in relation to symptoms. Appl.Ergon., 28(1), 41-47.
Hansson, G.-Å., Balogh, I., Byström, J. U., Ohlsson, K., Nordander, C., Asterland, P., Sjölander, S., Rylander, L., Winkel, J., Skerfving, S., & Malmö Shoulder-Neck Study Group. (2001). Questionnaire versus direct technical measurements in assessing postures and movements of the head, upper back, arms and hands. Scand.J.Work Environ.Health, 27(1), 30-40.
Holmström, E. B., Lindell, J., & Moritz, U. (1992). Low back and neck/shoulder pain in construction workers: occupational workload and psychosocial risk factors. Part 1: Relationship to low back pain. Spine, 17(6), 663-671.
Hoogendoorn, W. E., Bongers, P. M., de Vet, H. C., Douwes, M., Koes, B. W., Miedema, M. C., Ariens, G. A., & Bouter, L. M. (2000). Flexion and rotation of the trunk and lifting at work are risk factors for low back pain: results of a prospective cohort study. Spine, 25(23), 3087-3092.
International Association of Bridge, Ornamental, and Structural Ironworkers. About the Ironworkers. Retrieved 10/24, 2007, from http://www.ironworkers.org/about/aboutus.aspx
Jansen, J. P., Burdorf, A., & Steyerberg, E. (2001). A novel approach for evaluating level, frequency and duration of lumbar posture simultaneously during work. Scand.J.Work Environ.Health, 27(6), 373-380.
Jansen, J. P., Morgenstern, H., & Burdorf, A. (2004). Dose-response relations between occupational exposures to physical and psychosocial factors and the risk of low back pain. Occup.Environ.Med., 61(12), 972-979.
Jonsson, B. (1982). Measurement and evaluation of local muscular strain in the shoulder during constrained work. J.Hum.Ergol., 11(1), 73-88.
Ketola, R., Toivonen, R., & Viikari-Juntura, E. (2001). Interobserver repeatability and validity of an observation method to assess physical loads imposed on the upper extremities. Ergonomics, 44(2), 119-131.
Latza, U., Karmaus, W., Stürmer, T., Steiner, M., Neth, A., & Rehder, U. (2000). Cohort study of occupational risk factors of low back pain in construction workers. Occup.Environ.Med., 57(1), 28-34.
Marras, W. S., Lavender, S. A., Leurgans, S. E., Fathallah, F. A., Ferguson, S. A., Allread, W. G., & Rajulu, S. L. (1995). Biomechanical risk factors for occupationally related low back disorders. Ergonomics, 38(2), 377-410.
Mathiassen, S. E., Burdorf, A., van der Beek, A. J., & Hansson, G.-Å. (2003). Efficient one-day sampling of mechanical job exposure data--a study based on upper trapezius activity in cleaners and office workers. AIHA J., 64(2), 196-211.
Mathiassen, S. E., & Winkel, J. (1991). Quantifying variation in physical load using exposure-vs-time data. Ergonomics, 34(12), 1455-1468.
Mathiassen, S. E., Winkel, J., & Hägg, G. M. (1995). Normalization of surface EMG amplitude from the upper trapezius muscle in ergonomic studies - a review. J.Electro.Kinesiol., 5, 197-226.
Merlino, L. A., Rosecrance, J. C., Anton, D., & Cook, T. M. (2003). Symptoms of musculoskeletal disorders among apprentice construction workers. Appl.Occup.Environ.Hyg., 18(1), 57-64.
Mientjes, M. I., Norman, R. W., Wells, R. P., & McGill, S. M. (1999). Assessment of an EMG-based method for continuous estimates of low back compression during asymmetrical occupational tasks. Ergonomics, 42(6), 868-879.
Miller, B. J., & Fathallah, F. A. (2007). Body-fixed orientation sensors for trunk motion sensing. Proceedings of the Human Factors and Ergonomics Society 51st Annual Meeting, Baltimore, MD, United States. 933-937.
National Research Council - Institute of Medicine. (2001). Musculoskeletal Disorders and the Workplace. Washington, DC: National Academy Press.
NIOSH. (1981). Work Practices Guide for Manual Lifting No. Technical Report No. 81-122. Cincinnati: U.S. Department of Health and Human Services.
NIOSH. (2003). Work-Related Lung Disease Surveillance Report. DHHS Publication No. 2003-111. Cincinnati: U.S. Department of Health and Human Services, Public Health Service, Centers for Disease Control and Prevention, NIOSH.
Paquet, V., Punnett, L., Woskie, S., & Buchholz, B. (2005). Reliable exposure assessment strategies for physical ergonomics stressors in construction and other non-routinized work. Ergonomics, 48(9), 1200-1219.
Paquet, V. L., Punnett, L., & Buchholz, B. (2001). Validity of fixed-interval observations for postural assessment in construction work. Appl.Ergon., 32(3), 215-224.
Punnett, L., Fine, L. J., Keyserling, W. M., Herrin, G. D., & Chaffin, D. B. (1991). Back disorders and nonneutral trunk postures of automobile assembly workers. Scand. J.Work Environ.Health, 17(5), 337-346.
Redfern, M. S., Hughes, R. E., & Chaffin, D. B. (1993). High-pass filitering to remove electrocardiographic interfence from torso EMG recordings. Clin.Biomech., 8, 44-48.
Schneider, S. P. (2001). Musculoskeletal injuries in construction: a review of the literature. Appl.Occup.Environ.Hyg., 16(11), 1056-1064.
Seidler, A., Bolm-Audorff, U., Heiskel, H., Henkel, N., Roth-Küver, B., Kaiser, U., Bickeböller, R., Willingstorfer, W. J., Beck, W., & Elsner, G. (2001). The role of cumulative physical work load in lumbar spine disease: risk factors for lumbar osteochondrosis and spondylosis associated with chronic complaints. Occup.Environ.Med., 58(11), 735-746.
Solomonow, M., Baratta, R. V., Banks, A., Freudenberger, C., & Zhou, B. H. (2003). Flexion-relaxation response to static lumbar flexion in males and females. Clin.Biomech., 18(4), 273-279.
Spielholz, P., Silverstein, B., Morgan, M., Checkoway, H., & Kaufman, J. (2001). Comparison of self-report, video observation and direct measurement methods for upper extremity musculoskeletal disorder physical risk factors. Ergonomics, 44(6), 588-613.
Stern, F. B., Sweeney, M. H., & Ward, E. (1997). Proportionate mortality among unionized construction ironworkers. Am.J.Ind.Med., 31(2), 176-187.
Svendsen, S. W., Mathiassen, S. E., & Bonde, J. P. (2005). Task based exposure assessment in ergonomic epidemiology: a study of upper arm elevation in the jobs of machinists, car mechanics, and house painters. Occup.Environ.Med., 62(1), 18-27.
The Center to Protect Workers' Rights. (2002). The Construction Chart Book: The U.S. Construction Industry and its Workers (3rd ed.). Silver Spring, MD: The Center to Protect Workers' Rights.
Thorn, S., Søgaard, K., Kallenberg, L. A., Sandsjö, L., Sjøgaard, G., Hermens, H. J., Kadefors, R., & Forsman, M. (2007). Trapezius muscle rest time during standardised computer work - a comparison of female computer users with and without self-reported neck/shoulder complaints. J.Electro.Kinesiol., 17(4), 420-427.
U.S. Bureau of Labor Statistics. (2007). Union Members in 2006. Retrieved 10/24, 2007, from http://www.bls.gov/news.release/pdf/union2.pdf
Van Nieuwenhuyse, A., Somville, P. R., Crombez, G., Burdorf, A., Verbeke, G., Johannik, K., Van den Bergh, O., Masschelein, R., Mairiaux, P., Moens, G. F., & BelCoBack Study Group. (2006). The role of physical workload and pain related fear in the development of low back pain in young workers: evidence from the BelCoBack Study; results after one year of follow up. Occup.Environ.Med., 63(1), 45-52.
Veiersted, K. B., Westgaard, R. H., & Andersen, P. (1990). Pattern of muscle activity during stereotyped work and its relation to muscle pain. Int.Arch.Occup.Environ.Health, 62(1), 31-41.
Vi, P. (2006). A field study investigating the effects of a rebar-tying machine on trunk flexion, tool usability and productivity. Ergonomics, 49(14), 1437-1455.
Viikari-Juntura, E., Rauas, S., Martikainen, R., Kuosma, E., Riihimäki, H., Takala, E. P., & Saarenmaa, K. (1996). Validity of self-reported physical work load in epidemiologic studies on musculoskeletal disorders. Scand.J.Work Environ.Health, 22(4), 251-259.
Village, J., Frazer, M., Cohen, M., Leyland, A., Park, I., & Yassi, A. (2005). Electromyography as a measure of peak and cumulative workload in intermediate care and its relationship to musculoskeletal injury: an exploratory ergonomic study. Appl.Ergon., 36(5), 609-618.
Winkel, J., & Mathiassen, S. E. (1994). Assessment of physical work load in epidemiologic studies: concepts, issues and operational considerations. Ergonomics, 37(6), 979-988.
Wong, K. C., Lee, R. Y., & Yeung, S. S. (2009). The association between back pain and trunk posture of workers in a special school for the severe handicaps. BMC Musc.Dis., 10, 43.
Zipp, P. (1982). Recommendations for standardization of lead positions in surface electromyography. Eur.J.App.Phys., 50, 41-54.