
Welding Exposures in Construction, 30 Years of OSHA Data
Summary Statement
This presentation by Mike Flynn at the AIHA conference in May 2013, co-authored by Pam Susi of CPWR, was an analysis of an impressive data set of 30 years of welding sampling results from OSHA compliance inspections. The data set included 100,000 measurements collected on 30,000 welders from 1978 to 2008. The results indicated that heavy construction and structural steel erection had elevated risks of overexposure to manganese and lead jointly.
May 2013
Welding Exposures in Construction - 30 Years of OSHA Data
Michael R. Flynn
University of North Carolina Chapel Hill
mike_flynn@unc.edu
PO 136 Construction
Acknowledgements
- Co-author: Pam Susi, MSPH, CIH - Center for Construc8on Research and Training (CPWR)
- Funded in part by coopera8ve agreement OH009762 from Na8onal Ins8tute for Occupa8onal Safety and Health (NIOSH)
- Thanks to OSHA for providing the data set
Objectives
- Use OSHA data to characterize 8hr-TWA exposures to airborne contaminants associated with welding in the construc8on industry, with a focus on Mn.
- Explore mixed exposures with addi8ve effects especially Mn and Pb
- Test for any exposure trends in 8me over the 30 year period
OSHA DATA SET
- Data set obtained in 2008; over 100,000 measurements; ~30,000 welders in a wide variety of industries, from 1978-2008.
- A subset for the Construc8on Industry was extracted based on SICs (15xx, 16xx and 17xx) (N~2500).
Types of Data in the OSHA File that were used in this analysis
| Exposure Type | Inspection Type | Sample Type |
|---|---|---|
| Ceiling | Complaint | Personal |
| Peak | Follow Up | Bulk |
| TWA | Referral | Wood |
| Dose | Other | Blood |
| ND | Fatality | Urine |
| Not analyzed | Monitoring | Area |
| Short Term Exposure | Variance | |
| Not Valid | Unprogrammed | |
| Programmed |
Agents Ranked by Sample Size
| Substance | Count (N) | Zeros (<LOD) |
|---|---|---|
| Pb | 455 | 239 |
| Fe | 418 | 14 |
| Zn | 293 | 36 |
| Cu | 238 | 41 |
| Cr | 238 | 92 |
| Ni (ins) | 201 | 115 |
| Mn | 182 | 27 |
| Cd | 149 | 115 |
| Total | 112 | 7 |
| CrVI | 6 | 1 |
Select Exposures: Mean/ OEL > 0.5
| Mean | PEL | TLV | REL | Mean/ PEL | Mean/ TLV | Mean/ REL | |
|---|---|---|---|---|---|---|---|
| Mn | 0.10 | 5.0 | 0.1 | 1.0 | 0.02 | 1.0 | 0.1 |
| Cu | 0.12 | 0.1 | 0.2 | 0.1 | 1.2 | 0.6 | 1.2 |
| Pb | 0.22 | 0.05 | 0.05 | 0.05 | 4.5 | 4.5 | 4.4 |
| Ni ins | 0.045 | 1.0 | 0.2 | 0.015 | 0.05 | 0.2 | 3 |
| CrVI | 0.006 | 0.005 | 0.01 | 0.001 | 1.2 | 0.6 | 6 |
| Cd | 0.013 | 0.005 | 0.01 | Ca | 2.5 | 1.3 | NA |
| Zn | 2.67 | 5.0 | NA | 5.0 | 0.5 | NA | 0.5 |
2 digit SIC codes
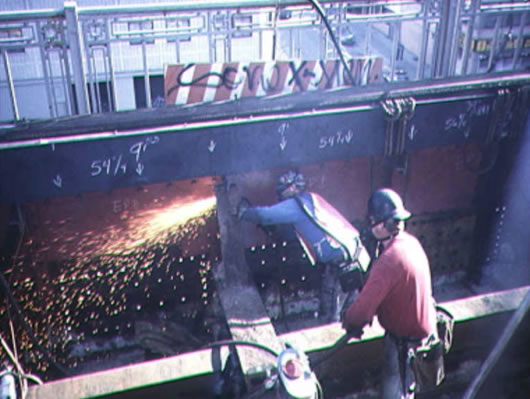
Ironworkers rehabilitating a steel bridge (could fall under 16XX or 17XX steel erection)
| SIC CODE | DESCRIPTION | EXAMPLES |
|---|---|---|
| 15xx | Building General Contractors | Includes residential, commercial, industrial buildings |
| 16xx | Heavy Construction | Includes roads, bridges, tunnels, water, sewer, power & communication lines |
| 17xx | Special Trade Contractors | Includes sub specialties - e.g. steel erection, plumbing, HVAC, & sheet metal work |
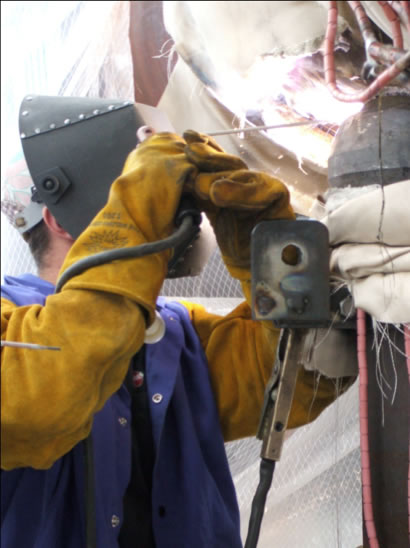
Welding Crafts in Construction
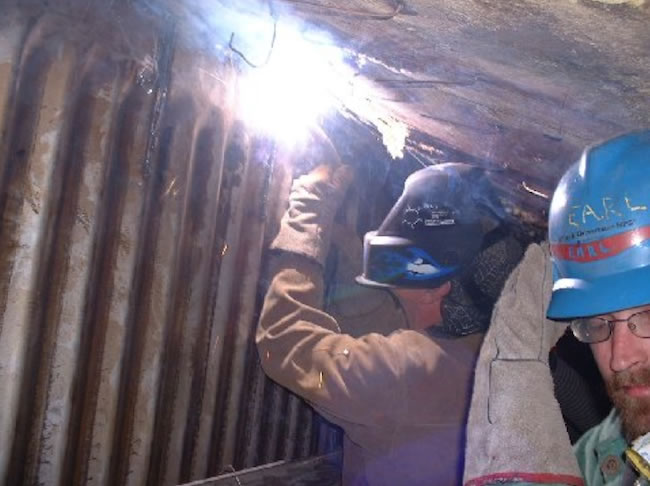
Boilermakers work on boiler tubes during power plant rehab/ maintenance
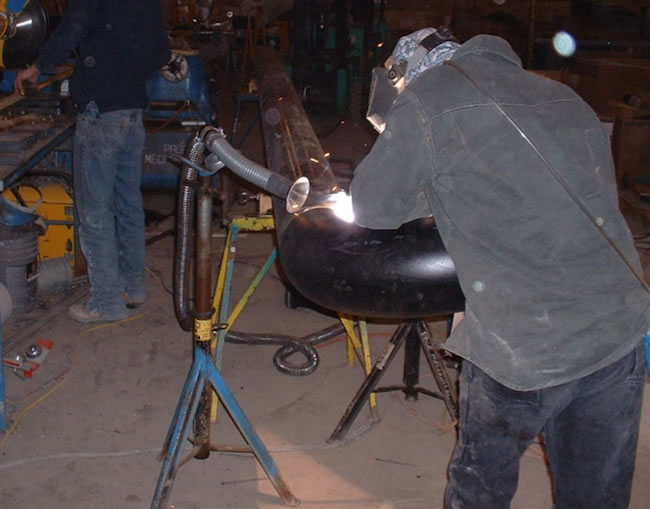
Pipe-fitter/ welder working on HVAC piping during new construction of a university building
Manganese by 2 digit SIC
| Mn | 15xx | 16xx | 17xx |
|---|---|---|---|
| Mean | 0.08 | 0.19 | 0.07 |
| Median | 0.04 | 0.06 | 0.03 |
| Std. Dev. | 0.10 | 0.35 | 0.10 |
| Maximum | 0.34 | 1.66 | 0.58 |
| Count | 19 | 52 | 111 |
| Fraction > TLV* | 0.32 | 0.37 | 0.25 |
*Inhalable Mn TLV = 0.1 mg/m3 2013
Lead by 2 digit SIC
| Pb | 15xx | 16xx | 17xx |
|---|---|---|---|
| Mean | 0.06 | 0.48 | 0.14 |
| Median | 0.00004 | 0.007 | 0.00004 |
| Std. Dev | 0.14 | 2.75 | 1.16 |
| Maximum | 0.70 | 28 | 19.06 |
| Count | 44 | 123 | 288 |
| Fraction > TLV* | 0.18 | 0.29 | 0.17 |
*Pb TLV = 0.05 mg/m3 2013
Descriptions of some 4 digit SIC
| SIC CODE | DESCRIPTION | EXAMPLES |
|---|---|---|
| 1629 | Heavy Construction not elsewhere classified | Petrochemical plant; power plant; pile driving, boilermakers |
| 1791 | Structural Steel Erection | Iron work, structural-contractors; Storage tanks |
| 1799 | Special Trade Contractors, NOC | Welding contractors, operating at site of construction: Lead burning contractors |
Manganese by 4 digit SIC
| Mn | 1629 | 1791 | 1799 |
|---|---|---|---|
| Mean | 0.22 | 0.17 | 0.05 |
| Median | 0.05 | 0.13 | 0.01 |
| Std. Dev. | 0.40 | 0.16 | 0.10 |
| Maximum | 1.66 | 0.58 | 0.35 |
| Count | 29 | 16 | 17 |
| Fraction > TLV* | 0.41 | 0.75 | 0.18 |
*Inhalable Mn TLV = .01 mg/m3 2013
Lead by 4 digit SIC
| Pb | 1629 | 1791 | 1799 |
|---|---|---|---|
| Mean | 0.58 | 0.10 | 0.13 |
| Median | 0.00004 | 0.03 | 0.00004 |
| Std. Dev. | 3.63 | 0.23 | 0.49 |
| Maximum | 28 | 1.45 | 2.9 |
| Count | 61 | 51 | 56 |
| Fraction > TLV* | 0.11 | 0.33 | 0.20 |
*Lead TLV = 0.05 mg/m3 2013
Additive exposures Pb and Mn: SIC 1791 86% > 1; SIC 1629 50% > 1
| SAMPLE | Mn/ TLV | Pb/ TLV | SUM |
|---|---|---|---|
| 1 | 2.00 | 0.66 | 2.66 |
| 2 | 1.48 | 0.32 | 1.80 |
| 3 | 1.10 | 2.40 | 3.50 |
| 4 | 3.40 | 0.74 | 4.14 |
| 5 | 3.34 | 0.64 | 3.95 |
| 6 | 1.18 | 0.00 | 1.18 |
| 7 | 0.06 | 0.00 | 0.06 |
| AVERAGE= | 1.79 | 0.68 | 2.47 |
| NUMBER > 1 | 6 | 1 | 6 (86%) |
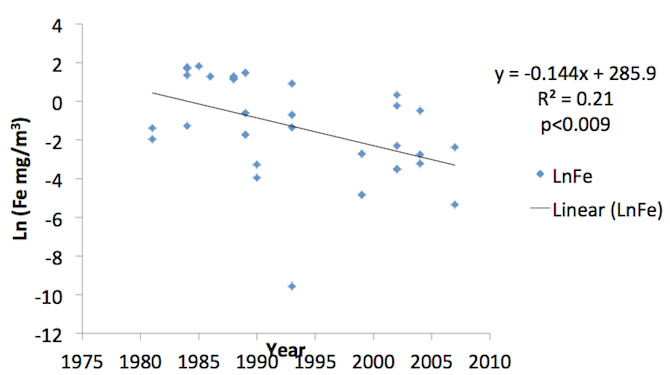
Iron Exposures vs. Year SIC 1799
Conclusions
- Welders in construction have been exposed to a wide variety of substances at levels in excess of current OELs.
- Lead, cadmium, copper, zinc, and hexavalent chrome were exposures with mean values over the PEL.
- Mean exposure of Mn was over the current TLV
- Heavy Construction NOC and Structural Steel Erection had elevated risk of overexposure (TLV) to Mn and Pb jointly. A neurological health concern.
- Limited evidence of declines in exposures over time; one detected - Fe in Special Trade Contractors
Recommendations
- Reduce the PEL for Mn.
- Increase the use of local exhaust ventilation.
- Target joint exposures e.g. Mn and Pb
- Target carcinogens: Cd, CrVI.
Summary of Select Exposure Data
| Substance | Count (N) | Zeros (F) | Mean | Median |
|---|---|---|---|---|
| Mn | 182 | 27 | 0.10 | 0.04 |
| Fe | 418 | 14 | 1.77 | 0.74 |
| Total | 112 | 7 | 3.28 | 1.97 |
| Cu | 238 | 41 | 0.12 | 0.005 |
| Pb | 455 | 239 | 0.22 | 0 |
| Ni (ins) | 201 | 115 | 0.045 | 0 |
| Cd | 149 | 115 | 0.013 | 0 |
| CrVI | 6 | 1 | 0.006 | 0.00006 |
| Cr | 238 | 92 | 0.056 | 0.002 |
| Zn | 293 | 36 | 2.67 | 0.03 |