
The Impact of IIPP Policies on Statewide Injury Rates May 2014 in U.S. Construction
Summary Statement
This report was funded by CPWR under its Small Studies Program. The authors examined an important claim by OSHA that Injury and Illness Prevention Programs (IIPPs) dramatically reduce workplace injuries. OSHA predicts that individual employers adopting IIPPs will experience as much
as a 35 percent drop in injuries, and statewide adoption of mandatory IIPPs would result in a 12 percent decline. This current study, a fixed effects panel data model of injury rates in U.S. construction from 1982 to 2008, shows that controlling for confounding factors including changes in reporting culture, long-term trends in injury reduction, business cycle and other economic factors, mandatory IIPPs reduce total construction
injury rates by 32 percent and lost workday injuries by 38 percent in areas of low union density. As construction union density rises, the impact of IIPPs declines. The relatively weak impact of both mandatory and quasi‐voluntary IIPPs in more heavily unionized construction is explained by the greater prevalence of joint union‐management training programs which provide practices and procedures similar to those promoted by IIPPs. The study's key findings:
1. The presence of mandatory and incentivized IIPPs has a larger impact in reducing most types of construction injury rates compared to either type of program alone or no program at all.
2. The effect of IIPPs is concentrated in nonunionized construction environments.
3. The effect of IIPPs in reducing injury rates is stronger for more serious injuries and weakest for light‐duty injuries, and the effect of IIPPs can be seen not only in the reduction of injury rates but also in a
shift in the distribution of injury accidents towards milder forms of injuries.
4. The use of past workers’ compensation rates and other economic and demographic control variables are useful in reducing the confounding effect of changes in injury reporting culture on the measure
reported injury rates over time.
5. The presence of union workers by itself, lowers injury rates: a 1 percentage point increase in the state‐level construction unionization rate leads 3.6 percent decline in days‐away‐from‐work injuries, a 2.9
percent decline in lost‐work injuries, a 1 percent decline in light‐duty injuries and 3.3 percent decline in no‐lost‐work injuries. The overall injury rate falls by 3 percent. Similar to the IIPP effect, the presence
of potentially better trained union workers reduce serious injuries and shift the accident distribution towards milder injuries.
May 2014
CONTENTS
Introduction
Model
Data
Results
Confounding factors controlled for in the basic model
Limitations
Conclusion
Figure 1: Predicted values for total injury rate by level of unionization and IIPP policy
Figure 2: Predicted values for lost workday injury rate by level of unionization and IIPP policy
Figure 3: Predicted values for lost‐workday injury rates by level of unionization and IIPP policy comparing no‐law to both-laws
Figure 4: Predicted values for lost‐work injury rates by level of unionization and IIPP policy
Figure 5: Predicted values for lost‐work injury rates by level of unionization and IIPP policy comparing no‐law to both‐laws
Figure 6: Predicted values for light‐duty injury rates by level of unionization and IIPP policy
Figure 7: Predicted values for no‐lost‐work injury rates by level of unionization and IIPP policy
Figure 8: Predicted values for no‐lost‐work injury rates by level of unionization and IIPP policy comparing no‐law to both-laws
Figure 9: Predicted values for four types of injury rates compared by level of unionization and IIPP policy
Table 1: Descriptive statistics
Table 2: Fixed effects linear regression models predicting the log of five types of injury rates
Introduction
While reported injuries have been falling for decades, construction remains among the more dangerous industries in the U.S. workers’ compensation insurance rates reflect this. In 2012, the unweighted average workers’ compensation insurance rate across 67 construction occupations/activities was $14 per $100 of payroll. The framer rate in Hawaii was $35; roofers in Illinois $42; pile‐drivers in Mississippi $12; bridge workers in North Carolina $16, and so on. While the market provides some incentives for contractors to work more safely in order to reduce workers’ compensation costs and avoid accident‐caused construction interruptions, the public dissemination of information about construction safety technologies and procedures along with regulations are also advocated. Injury and illness prevention programs are among such policies aimed at providing workers with information regarding safety practices and providing contractors with management strategies aimed at reducing workplace injuries and illnesses.
The U.S. Occupational Safety and Health Administration, OSHA, argues that injury and illness prevention programs (IIPPs) are proven tools to find and fix hazards before injuries occur on the worksite. According to OSHA, IIPPs alter workplace safety culture and thereby reduced injuries. Subsequent to the introduction of IIPPs, OSHA claims that for employers who adopt IIPPs, injuries fall by 15 to 35 percent from pre‐IIPP levels. OSHA estimates that overall injury rates across all industries and across all employers, including both those who have had and those who previously have not had IIPPs, would fall by 12.4 percent with the universal adoption of IIPPs. (OSHA 2012) This underscores the observation that the marginal state‐level effect of implementing an IIPP will, in part, be a function of the extent of pre‐existing voluntary IIPPs in that state.
IIPPs may be voluntary with government or others providing templates and information regarding effective IIPP procedures. IIPPs may be quasi‐voluntary by incentivizing IIPP adoption through reduced workers’ compensation insurance premiums or other incentives (Liu, H. et al., 2008). IIPPs may also be mandated with possible exemptions for safer industries or smaller sized firm. IIPP policy may also be a mixture of information dissemination, incentives and mandates.
Much of OSHA’s optimism regarding the potential impact of IIPPs is based on experience with voluntary IIPPs. OSHA cites, for instance, the Department of Defense’s voluntary protection programs (VPPs) which saw a 41 percent decline in the lost‐day injury rate from 31.5 per 100 fulltime‐equivalent workers prior to the introduction of VPPs to 18.7 after their introduction (OSHA 2012, Angelo 2010). OSHA also cites studies of voluntary company‐level implementation of IIPPs that together yield the conclusion that IIPPs transform workplace safety culture, reduce injuries, illnesses and fatalities, lower workers’ compensation costs, improve morale and communication, enhance image and reputation and facilitate production. (Alsop and LeCouteur, 1999; Bunn et al., 2001; Conference Board, 2003; Huang et al., 2009; Lewchuk et al., OSHA 2012; 1996; Smitha et al., 2001; Torp et al., 2000; Yassi, 1998)
In contrast to OSHA’s optimism regarding the overall benefit of IIPPs, LaTourrette and Mendeloff (2008) while acknowledging the consensus regarding voluntary IIPPs, focused on the impact of mandatory IIPPs on workplace injuries and illnesses. They found that the relevant literature was limited and methodologically weak. As a result, even though the available literature concluded that mandatory IIPPs reduce injuries and illness, LaTourrette and Mendeloff could not themselves conclude with confidence that mandatory IIPPs were effective. In reviewing two studies that focused on changes in statewide injury rates subsequent to the mandated introduction of IIPPs, LaTourrette and Mendeloff criticized an OSHA (1998) study which concluded that injury rates had fallen across a set of industries by an average of 18 percent because OSHA had not controlled for other factors that may have influenced changes in injury rates. Among LaTourrette and Mendeloff’s criticisms, they wish that OSHA had included lost workdays along with total injuries as measures of injury rates. They also argued that it would have been better to compare states with IIPPs to states without IIPPs rather than comparing states with mandated IIPPs to all non‐IIPP states lumped together as a group. They objected to the use of multi‐year averages rather than observing each year before and after the policy change separately. LaTourrette and Mendeloff also wished that each state’s results would have been analyzed separately. They also noted that it was difficult to take into account differences in reporting culture by state. They argued that when doing cross‐state comparisons potential differences by state in under‐reporting of injuries can bias results.
LaTourrette and Mendeloff approve of Smitha et al.’s (2001) attempt to control for confounding factors in analyzing the effect of IIPPs on state‐level injury rates. Smitha et al. found that depending on the statistical model used, mandatory IIPPs reduced state‐wide injuries by an estimated 4 percent to 13 percent. However, LaTourrette and Mendeloff criticize Smitha et al. for a heavy reliance upon only a few states for their results and an unexpected and counterintuitive finding that higher maximum workers’ compensation benefits lead to lower reported injury rates. These criticisms make LaTourrette and Mendeloff reluctant to accept Smitha et al.’s conclusions. LaTourrette and Mendeloff conclude that the failure to find unambiguous and consistent reductions in injuries in states that have adopted mandatory IIPPs means that an average reduction in injuries of 20 percent in workplaces that previously did not have IIPPs as OSHA suggests is unlikely.1
Mendeloff et al. (2012) were also skeptical of both the case‐study and state‐level research on the effectiveness of safety programs. Concern regarding the representativeness of case studies was heightened by concern that new state-level safety initiatives are often adopted soon after unusually bad years for injuries. If, subsequently, injuries revert back to previous levels, IIPPs or other policy interventions would appear to have caused this change because the policies were benchmarked against the (hypothesized) abnormally high recent injury rates which presumably stimulated the policy change. Mendeloff et al. (2012) citing Mendeloff et al. (2011) also argue that in construction, higher injury rates are negatively correlated with lower death rates. Conceivably, in safer construction workplaces, an accident event is more likely to result in a serious injury or even a non‐serious injury rather than a death. Donado (2013) calls this accident-distribution shifting. Accident‐distribution shifting can yield perverse results when researchers focus on less than the full range of injury/fatality outcomes.
Because fatality data and injury data are collected and usually analyzed separately, accident distribution shifting between injuries and fatalities can occur unobserved. Hypothetically, with accident shifting between injuries and fatalities, higher injuries rates may in fact indicate safer workplaces as fatalities become injuries while lower injury rates may imply a more dangerous workplace with more accidents resulting in workplace deaths. Thus, in studies such as Smitha et al. (2001), finding that the level of injuries is lower subsequent to the implementation of IIPPs may actually indicate that IIPPs increase safety risks, taken as a whole, by transferring more workplace accidents from injuries into deaths. Why IIPPs would increase workplace dangers remains unclear, and Mendeloff et al. (2012) were careful to emphasize that the potential for regression‐to‐the‐mean due to the timing of political reform or measurement bias due to accident-distribution shifting does not necessarily mean that these biases actually exists. But Mendeloff et al. (2012) conclude that the bias potential in IIPP state‐level effectiveness research is sufficient to abstain from concluding that mandatory IIPPs have reduced the overall risk of workplace safety or even reduced the risk of injuries.
An overall theme in both LaTourrette and Mendeloff (2008) and in Mendeloff et al. (2012) is that studies of mandatory IIPPs do not consider enforcement. LaTourette and Mendeloff argue that there is credible evidence suggesting that firms voluntarily implementing IIPPs achieve reductions in workplace injuries and illnesses. While this casts doubt on the notion that IIPPs would stimulate an adverse accident‐distribution shift, the study of voluntary IIPPs yields little insight regarding the effect of mandatory IIPPs. If enforcement is weak and employers are uninterested or unwilling IIPP participants, mandatory IIPPs may have little effect on state‐wide injury rates. Thus, Mendeloff and his coauthors are doubtful whether mandatory IIPPs will be more than “paper” programs which OSHA admits are ineffective (OSHA 2012).
This paper addresses some of the foregoing criticisms of the literature evaluating the state‐level impact of IIPPs on injury rates focusing on the construction industry. For construction, we examine all five U.S. Bureau of Labor Statistics (BLS) injury categories, from the mildest no lost work injuries to the most severe lost workday injury cases, allowing us to observe potential injury‐distribution shifts. We do not examine fatalities. This exposes us to the possible perverse accident‐distribution outcome that IIPPs make workplaces more dangerous resulting in fewer injuries but more fatalities. Because the case study literature concludes that voluntary IIPPs make workplaces safer, we assume that the foregoing logical perverse possibility is empirically unlikely.
Using state‐level injury rate data for 41 states over the period 1982 to 2008, we follow Smitha et al. (2001) in attempting to control for confounding factors through statistical techniques. In particular, we attempt to control for state variation and overtime variation in reporting culture by including workers’ compensation premium and demographic variables that may stimulate or facilitate under‐reporting.
By examining many states over many years with substantial before as well as after periods in the analysis, we reduce the potential for regression‐to‐the‐mean bias associated with brief spikes in injury rates stimulating policy changes.
Our analysis examines mandatory IIPPs in comparison to quasi‐voluntary IIPPs incentivized by workers’ compensation insurance premium reductions. We are able to compare the relative marginal effects and their combined effects on injury rates. This addresses the concern that mandatory IIPPs will be ineffective if enforcement is lax and participation is involuntary.
While we are unaware of systematic data regarding state variations in the use of IIPPs, there is systematic data on construction unionization by state. Unionized construction contractors benefit from the safety training that is integral to union apprenticeship and post‐apprenticeship training. While some nonunion contractors run apprenticeship programs, approximately 75 percent of all registered construction apprentices are in joint union‐management apprenticeship programs (Bilginsoy 2003; Glover and Bilginsoy 2005). We use unionization rates by state to proxy a measure for the existence of voluntary IIPPs. We hypothesize that where IIPP‐like programs are already in place, the impact of newly mandated IIPPs will be less.
In the next section we describe the models we use to test the effect of IIPPs on injury rates. The third section will describe our data. The fourth section reports our results. In the conclusion, we summarize this research identifying its limitations and outlining potential directions for future analysis.
Model
We agree with LaTourrette and Mendeloff that, where possible, it is important to control for confounding factors when estimating the state‐level impact of mandatory or incentivized IIPPs on injury rates. Here we employ weighted, fixed‐effects, linear regression models with errors clustered by state on state‐contractor‐type level panel data for the years 1982 to 2008. We predict separately five measures of construction injury rates corresponding to the BLS categories (no-lost‐work, light duty, lost‐work, lost work resulting in days away from work, and total injuries). The level of observation is for specific construction contractor types (plumbers, electricians, painters and roofers) in 41 states for each year of our study. Because of the craft nature of construction, these specialized subcontractors will tend to employ blue collar workers whose occupations are the same as the industry category. This allows us to link industry categories to corresponding occupational workers’ compensation rates. The states excluded due to insufficient injury data are Colorado, Idaho, New Hampshire, North Dakota, Ohio, South Dakota, Washington, West Virginia and Wyoming, as well as the District of Columbia.
Model specification is as follows:
Yijt*= ai* + βkxijt* + βzxjt* + uijt* [see footnote2]
where xijt* is a 1 x k vector of independent variables that vary over contractor type, state and year, xjt* is a 1 x z vector of independent variables that vary over state and year, βk and βz are the vectors of coefficients in independent variables, and uijt* is the disturbance term.
Data
The BLS injuries, illness and fatalities program reports injury rates for construction by contactor type. Prior to 2003, construction contractors were classified by the Standard Industial Classification (SIC) codes while subsequent to 2003 the North American Industry Classification System (NAICS) has been used. For contractor types, we have selected four categories, plumbers, painters, electrical and roofing contractors. These industry categories were unchanged in the switch from SIC classifications to NAICS classifications (Census 2000).
We examine all five BLS injury categories—no‐lost‐work, light duty, lost work, lost‐work with days of work lost, and total injuries. Through improving workplace safety, IIPPs may lower accident rates, but they may also, as Mendeloff (2012) postulates, alter the composition of accident outcomes. Since our data do not include fatalities, we cannot observe the hypothesized possibility that lower fatality rates lead to higher injury rates via accident‐distribution shifting. But we do observe the total injury rates for these construction contractor types and the range of injuries from more serious days-away‐from‐work injuries to the least serious no‐lost‐work injuries. This provides us with an opportunity to observe not only changes in injury rates but also possible changes in the composition of accidents from more to less serious injuries.
While our observation of injuries is at the year‐state‐contractor‐type level, with the exception of corresponding workers’ compensation insurance rates, the covariates in the model are construction averages for the year‐state. We thus proxy year‐state‐specialty‐contractor level data with year‐state‐construction level data in most covariate cases.
Workplace reporting culture is elusive due to the illegal nature of under‐reporting and misclassification of injuries. We proxy workplace injury‐reporting culture with the percent Hispanic of all construction workers within a state and year. Cigularov et al. (2013) reported that Hispanic construction workers scored contractors’ safety commitment higher than non‐Hispanic whites. Cigularov et al. concluded that this result was consistent with the hypothesis that Hispanic construction workers were less willing to question employer authority and/or had lower expectations regarding management relative to safety. If Hispanic workers are less willing to criticize contractors over safety and have lower expectations regarding contractors’ approach to safety, it may well also be true that Hispanic workers better tolerate contractors failing to report injuries or classifying those injuries as less serious than would be acceptable to non‐Hispanic construction workers. In short, the presence of Hispanic construction workers may be positively correlated with a culture of under‐reporting or misclassifying injuries. If this is true, all other things being equal, we hypothesize that a higher percentage of Hispanics among construction workers will result in a lower reported injury rate.
However, it may also be true that actual safety risks for Hispanic construction workers are higher than that for non‐Hispanic construction workers. In the 2000s, the fatality rate for both native and foreign‐born Hispanic construction workers was higher than rates for non‐Hispanic workers, although the rates converged at the beginning of the Great Recession in 2008—the end of our data (Dong et al. 2010). Consistent with this convergence in the later 2000s, in averaging 2006 to 2008 fatality rate data for construction and extraction industries combined, Byler et al. (2013) found that the fatality rates of Hispanic compared to all workers to be basically the same. In contrast to fatality rates, injury and illness rates for Hispanic workers over the period 1992 to 2008 were consistently close to, if not slightly above, that of white, non‐Hispanic construction workers (Dong et al. 2010). While higher Hispanic fatality rates were partially associated with Hispanics working more risky construction occupations, even among laborers and roofers Hispanics had elevated fatality rates (Dong 2004).
Taken together 1) the probability that Hispanic construction workers are not, as a rule, facing less safety risks on construction sites compared to non‐Hispanics (if anything, they face more risks), and 2) given, as a rule, Hispanic workers compared to non‐Hispanics are not more likely to demand that a workplace injury be reported more often and treated as more seriously (if anything, Hispanics will tolerate under‐reporting and misclassification more), we hypothesize that, controlling for other factors, if reported injury rates are lower where the percentage of Hispanics among all construction workers is higher, then this is an indication of a lax workplace injury‐reporting culture.
Injury rates vary by occupation and location. We use the annual state‐level, inflation‐adjusted, average workers’ compensation rate for the occupations plumber, electrician, painter and roofer reported in the trade publication Engineering News Record (1977 to 2008) to capture this variation. But contractors may also respond to the cost of workers’ compensation insurance by improving worksite safety, reclassifying identical accidents to a milder injury category and/or altering workplace reporting culture towards under‐reporting. We use the real workers’ compensation insurance rate lagged five years to capture the incentive to alter workplace safety and/or reporting behavior due to this market incentive. We cannot parse which of the two—greater safety or greater under‐reporting—may have been driven by past workers’ compensation rates, but this variable will help control for the confounding factor of economic incentives to do either or both.
Older and potentially more experienced construction workers may be safer (Siu et al. 2003; Langford et al. 2000). We measure this possible confounding factor with the average construction worker age in a state and year from the Current Population Survey (CPS) (BLS 1982 to 2008).
Better trained and more skilled construction workers may be safer (Sawacha et al. 1999) and we measure this possible confounding factor with the state‐level, inflation‐adjusted, average weekly construction wage from the CPS (BLS 1982 TO 2008).
Construction injury rates may be pro‐cyclical (Robinson and Shor 1989). As construction enters the boom, work speeds up to meet owners’ stricter completion dates. Faster work may be more dangerous. In a downturn, as contractors shed workers, they are likely to retain their better workers longer. Better workers from a contractor’s perspective may also be safer workers. We control for the cyclicality of construction using the state‐level annual average construction unemployment rate. We hypothesize that higher unemployment will lead to lower injury rates. (There may be an underreporting element here as well. When construction unemployment is high, workers may be more willing to tolerate contractors treating more serious injuries as light‐duty or no‐lost‐work injuries.)
Approximately three‐fourths of all construction apprentices are enrolled in joint union‐management programs (Bilginsoy 2003). Controlling for differences in wages, union construction workers may be more skilled, better trained overall, and more exposed to safety training through formal apprenticeship programs. We control for this potentially confounding factor with the construction unionization rate calculated from the CPS (BLS 1982 to 2008).
We have gathered two measures of IIPPs. The first are states with mandatory IIPPs requiring all construction contractors (sometimes above a minimum employment threshold) to have an injury and illness prevention program. We measure these with an indicator variable equaling zero in all states/years when no mandatory IIPP is required and one for those states and years when IIPPs are mandated. We have no data on variations in enforcement within states over time or across states.
The second IIPP variable is a quasi‐voluntary regulation where contractors that voluntarily implement IIPPs receive a discount on their workers’ compensation insurance premium. Again we indicate the presence of such a policy with a 0/1 dummy variable. These regulatory data come from OSHA (2012) and state‐government website searches. We have no data on variations in insurance premium discounts over time or across states. The absence of information on the level of enforcement or variations in premium incentives is a weakness in our focus‐variables data.
As indicated earlier, union construction workers are more likely to have received safety training or more extensive safety training. Joint union‐management apprenticeship programs are more likely to instill a safety ethos among workers and on jobsites. By interacting the unionization rate with the mandatory IIPP variable, we identify the extent of preexisting IIPP‐similar programs and cultures within a state by before and after the implementation of a mandatory IIPP. Similarly, by interacting unionization with the insurance discount variable, we identify the extent of pre‐existing IIPP-similar programs and cultures within a state by before and after the implementation of a quasi‐voluntary IIPP policy.
By interacting the mandatory and insurance‐incentive IIPP dummy variables, we identify those states and years where both the mandatory and quasi‐voluntary IIPP programs were in effect.
We limit our data to 1982 to 2008 for three reasons. First, with the advent of the Great Recession, the construction industry lost 30 percent of all its jobs by 2009. This compares to 6 percent of jobs across all industries lost by 2009 (Goodman and Mance 2011). The Great Recession is an especially anomalous period for construction. Second, the slow jobs recovery since 2009 has been especially protracted in the case of construction. This extends out the period of anomaly for construction past available data. Third, the convergence of Hispanic and non‐Hispanic reported injury rates at the outset of the Great Recession raises questions regarding continuing to use Hispanics as a measure of reporting culture going forward. For these reasons, we have chosen to end our series in 2008 with the intention of revisiting this research when the full effects of the Great Recession may be better measured, with a return to relative normality for this volatile labor market.
Results
Table 1 provides sample weighted descriptive statistics for the total injury rate (model 5). The sample descriptive statistics for models 1 through 4 are similar. Observations are weighted based on the size of the construction labor force in each state and year. Hispanics are a weighted‐average 27 percent of all construction workers in our regression sample. The contemporaneous workers’ compensation insurance rate is a weighted average of $18 per $100 of payroll and the 5‐year‐lagged workers’ compensation rate is $19. The weighted average construction worker age is 38.6 years and the construction unemployment rate is 7.9 percent. Real average weekly wages are $812 and the weighted average unionization rate is 13 percent. Of the 2043 observations in the total injury rate sample, mandatory IIPP laws were found without insurance incentives in 359 state/years. Mandatory IIPPs were found with insurance incentives in 71 state/years. Insurance incentives with no mandatory IIPPs were found in 11 state/years while neither IIPP policy was found in 1602 state/years.
Confounding factors controlled for in the basic model
TIME-INVARIANT EFFECTS
The level of observation for our study is an injury rate for a type of contractor (plumber, electrician, painter or roofer) within a state and year. Over the timespan of our study, 1982 to 2008, there may be some factors that influence differences in injury rates between these groups that do not vary with time. These could include geographic and climatic factors such as altitude, terrain, wind, seasonal differences in daylight, etc. They could also include social, cultural and economic factors that are time invariant over the period 1982 to 2008 including urban density, religious climate, state-based labor market policies, etc. And they include time‐invariant differences in safety risk by contractor type. In a fixed effects regression model, these factors are controlled for by a technique similar to introducing a 0/1 dummy variable across all years for each state‐craft group. These potential effects are controlled for implicitly and are not reported in the regression results.
TIME TREND EFFECTS
Over the period 1982 to 2008, construction injury rates reported by the BLS generally fell (CPWR 2013). So, for instance, in our data the total cases injury rate for plumbing contractors fell from 15.6 to 6.4; for painting contractors the total cases injury rate fell from 10.2 to 3.1; electrical fell from 13.2 to 4.9 and roofing fell from 22.5 to 6.4. While we include some factors in our model such as the construction business cycle, construction workers average age, workers’ compensation insurance premiums, real wage rates or unionization rates that may influence these trends, other factors such as OSHA inspections, changes in safety technology, societal focus on health and safety, etc., are not included. To control for these potential confounding factors, we include a continuous variable, year, as a linear time trend.
Table 2 shows the results of weighted fixed effects linear regression models estimating the natural log of injury rates for five types of injuries—no lost work, light duty work, lost work, lost work with days away from work and total injuries. Because the dependent variable injury rates are all measured in logs, the estimated coefficients may be read approximately as percent changes in injury rates due to a unit change in the corresponding independent variable. Thus, in the case of the time trend, for injury types except light duty work, Table 2 shows that there is a statistically significant negative time trend estimating a 4 percent to 6 percent drop in the injury rate across these four injury rate measures.3
In marked contrast, the time trend for the light duty work injury rate is a statistically significant estimated 6 percent increase per year. In many of our results, the light‐duty injury rate behaves differently than the other injury types—days away from work, lost workdays and no lost workdays. Understanding the effect of a safer workplace on injury rate levels and accident distribution helps explain these differences. Assume for the moment that a policy change induces a safer worksite. The number of accidents may go down and/or the severity of accidents may decrease. A decline in accidents would cause injury rates to fall, while a shift towards milder accidents would cause more severe injury rates to fall but may or may not causes less severe injury rates to fall. In the hypothetical case where a safer work policy did not reduce the number of accidents at all but shifted accidents to milder outcomes, severe injury rates would fall and milder injury rates would rise. This is a possible explanation for the time‐trends for days‐away‐from‐work injury rates and lost‐work injury rates to be negative and the light‐duty injury rate time‐trend to be positive. However, it may also be that a change in reporting culture favoring categorizing severe injuries as light‐duty injuries could have the same effect.
REPORTING CULTURE
The possibility of under‐reporting and particularly changes in the tendency to under‐report haunts interpretations of aggregate injury rate statistics. Our models attempt to control for this elusive illegal behavior where possible. One variable is specifically aimed at reporting culture. We assume that Hispanic workers in terms of their skills and workplace power are no safer than non‐Hispanic workers. We also assume that within each of these occupations—plumbers, electricians, painters and roofers—Hispanic workers do not face fewer risks of injury. We hypothesize that if the percent Hispanic among construction workers in a state is statistically significantly negatively correlated with injury rates that would reflect changes in injury‐reporting culture.
Table 2 shows that in four of our five models, we find no statistically significant relationship between percent Hispanic and injury rates. However, in the case of no‐lost‐work injuries, a one percentage point increase in the percent Hispanic corresponds to a 0.6% lower no‐lost‐work injury rate. This is statistically significant at the 10 percent level. It may be that our time trend has captured serious accidents increasingly reclassified over time as light duty injuries, while our Hispanic variable has captured reclassifying light‐duty injuries as no‐lost‐work injuries where Hispanic workers are more common. Whether we have controlled adequately for changes in reporting culture with our time‐trend and Hispanic variables remains an open question.
TIME-VARIANT SPATIAL AND GEOGRAPHIC DIFFERENCES IN INJURY RISKS
The risk of injuries may vary across our four occupations and across states. To the extent that these differences are time‐invariant, the structure of fixed effects models controls for these differences. However, if these occupational and geographical differences in injury risk change over time, the fixed effects will not capture this. Because current workers’ compensation rates by occupation are set based on recent injury experiences for each occupation, we include as a proxy for time‐variant differences in occupational injury exposure differences the base workers’ compensation rate in dollars per $100 of payroll for each year, in each state for each occupation in order to capture these possible time‐variant differences in injury risk. In Table 2, in cases of more severe injuries, a $10 increase per $100 of payroll in the contemporaneous workers’ compensation rate results in a statistically significant 3 to 5 percent increases in lost‐work and days‐away‐from-work injury rates. The other three injury rate estimates indicate that a $10 increase in workers’ compensation premiums leads to a 1.5 to 2 percent increase in the corresponding total, light‐duty and no‐lost‐work injury rates. However, these estimates are not statistically significant. We conclude that we have controlled adequately for potentially confounding time‐variant differences in injury risk by state and occupation.
MARKET INCENTIVES TO REDUCE REPORTED INJURIES
Workers’ compensation premiums impose a significant cost on construction contractors. These prices may induce contractors to improve the safety climate of their workplace and/or alter their reporting climate in order to reduce reported injuries, improve their experience rating and consequently reduce their workers’ compensation costs. We use the state baseline workers’ compensation premium per $100 of payroll by occupation five years prior to the year of the predicted injury rate to capture past incentives that may have, over time, altered contractor safety and/or reporting culture.
In Table 2, all estimates of the effect of five‐year‐lagged workers’ compensation premiums on injury rates are negative except in the case of light duty injuries. However, only the estimate for the most serious of the injuries, work-lost‐ injuries resulting in lost‐workdays (model 4) and light‐duty injuries are statistically significant. A $10 per $100 of payroll higher workers’ compensation premium five years ago results in a 3 percent lower days‐away‐from‐work injury rate today.
The estimate for lost‐work injuries is negative but not statistically significant. The light‐duty injury rate responds positively to past increases in workers’ compensation rates and the no‐lost injury rate turns negative. This is a pattern similar to the time‐trend variable discussed above. The same story of accident‐distribution downward shifting can be told here. Either due to a safer worksite or an adverse change in reporting culture, reported days‐away‐from‐work injuries decline. Lost work injuries also decline but perhaps because of a spillover from days‐away injuries, the fall in reported lost-work injuries is smaller (a 1 percent decline due to a $10 increase in 5‐year‐lagged workers’ compensation rates) and not statistically significant. The effect of past workers’ compensation rates on the current light‐duty injury rate is quite large. A $10 workers’ compensation increase five years ago generates a 10 percent increase in light duty injuries today. If safer work means milder accidents, then these mild accidents for some reason are pooling up in light‐duty work. If on the other hand, past workers’ compensation rates induce an injury classification change in reporting culture, actually more severe injuries may be pooling up in light‐duty work due to the difficulty in classifying these severe injuries as no‐lost‐work injuries.
Either interpretation is possible. We conclude that taken together, our year trend, percent Hispanic variable and lagged workers’ compensation variable, are capturing a significant (yet undetermined) amount of the effect of changing reporting culture on reported injuries. This provides some confidence when interpreting subsequent variables in the model that we are measuring, primarily the effects of those variables on workplace safety rather than reporting culture.
CONSTRUCTION WORKER AGE AND EXPERIENCE
Older and more experienced construction workers may or may not work more safely (Dong et al. 2012). In our data, the average age of construction workers rose from 37.9 years to 41.1 years over the 1982 to 2008 period. In Table 2, the state level average age of construction workers is estimated to be negatively correlated with all of the injury rate types but in no model are the estimates statistically significant.
STATE-LEVEL CONSTRUCTION UNEMPLOYMENT RATE
We expect injury rates to decline in the trough and increase in the boom due to the changing pace of construction work (Azari‐Rad et al. 2002). In Table 2, the total and two more severe injury rates have negative coefficients while light-duty and no‐lost‐work have positive estimates and in no case are the results statistically significant.
REAL AVERAGE STATE-LEVEL CONSTRUCTION WORKER WEEKLY WAGE
We expect higher‐paid construction workers to be more skilled and experienced and consequently safer workers. In Table 2, all of the estimates for the weekly wage on injury rates are negative and all but the light‐duty model generate statistically significant coefficients. A $100 increase in the real average state‐level construction wage decreases the total injury rate by 5 percent.
Scanning the estimates from more serious to less serious, the estimated negative effect of higher wages on injury rates is strongest for days‐away‐from‐work injuries and monotonically weaker for milder forms of injuries. Whereas a $100 increase in real weekly wages results in an 8 percent decline in the days‐away‐from‐work injury rate, the same $100 increase in real wages results in a 5 percent decline in the no‐lost‐work injury rate. The light‐duty injury rate fits the pattern but is statistically insignificant. Given our increased confidence that we have controlled for changes in reporting culture, we interpret these results as indicating an improved safety environment. This improved safety culture is associated with higher paid and therefore more skilled workers, and results in a decline in accidents and a shift in the composition of accidents towards milder injuries with no pooling up in light‐duty work due to changes in injury reclassification.
UNIONIZATION
Union workers may be safer workers due to better training (Gillen 2002). However, a union electrician, for example, may be more likely found in commercial and industrial construction while a nonunion electrician may be more likely found in residential construction. Thus, if dangers vary within occupation by construction market segment, union and nonunion construction workers may face differential safety risks.
In Table 2, the estimated effect of state‐level construction unionization rates indicates that a 1 percentage point increase in the state‐level construction unionization rate leads to a statistically significant roughly 3.6 percent decline in days‐away‐from‐work injuries, a 2.9 percent decline in lost‐work injuries, a 1 percent decline in light‐duty injuries and 3.3 percent decline in no‐lost‐work injuries. The overall injury rate falls by 3 percent. The total and more severe injury categories are statistically significant while the light‐duty and no‐lost injury rates are not. Assuming that we have successfully controlled for changes in reporting culture, these results suggest that better trained union workers reduce serious injuries and shift the accident distribution towards milder injuries resulting in the statistical insignificance and, in the case of light‐duty work, the smaller negative effect of an increase in construction unionization.
POLICY VARIABLES: MANDATORY AND INCENTIVIZED IIPP
The policy variables in Table 2 are constructed so that in comparison to jurisdictions and years where there are no IIPP laws, we can measure the effect of mandatory IIPP policies by themselves, quasi‐voluntary IIPP insurance incentivized programs by themselves, both laws together and all four possible legal regimes (no‐law, mandatory, insurance‐reduction and both‐laws) across varying levels of unionization. Recall that the aggregate effect of IIPPs on state‐level injury rates will partly depend on the extent of pre‐existing IIPP‐similar programs. Varying levels of unionization is our proxy measure for non‐IIPP‐induced broad‐scale safety training and workplace safety management.
The five models in Table 2 include dummy variables indicating the presence of mandatory IIPPs and quasi-voluntary IIPPS and additionally two interaction terms—a dummy variable indicating mandatory IIPPs times the unionization rate and a dummy variable indicating the quasi‐voluntary IIPPs incentivized with insurance premium discounts also times the unionization rate.
We justify this model specification as follows: Unions have an incentive to encourage safer working conditions associated with pressure from members wishing to avoid personal injuries. Donado (2013) provides three reasons why unions may reduce jobsite injury risks: 1) unions provide job hazard information; 2) unions protect workers who refuse to accept dangerous tasks; and 3) unions bargain for safety devices. In addition to these general union effects, in U.S. construction, unions jointly manage with contractors apprenticeship and post‐apprenticeship training programs. Construction unions have significant input regarding the nature and amount of safety training in these programs. Thus, there is pressure from worker organizations to have IIPP‐similar programs and procedures.
Furthermore, there are economies of both scale and portability‐of‐training across contractors in joint unionmanagement construction training programs. These economies, rooted in collective bargaining, lower the costs of safety training. IIPP‐similar programs are common in unionized construction in part because, all other things being equal, multiemployer training is portable training. Due to the volatility of construction and the casual nature of labor relations in the construction industry, contractor financed human capital investment of any sort runs the risk of being lost when the worker leaves the contractor. The benefits of employer‐financed, IIPP‐similar, safety training is more easily retained by investors when that human capital is a collective investment and the safety‐trained workers are portable across a set of unionized contractors sharing that mobile workforce. Union contractors may in reality invest more per worker in safety training, but because the fruits of that investment are more easily retained, the ultimate cost of safety training may be less (Kim and Philips 2010).
Thus, in the U.S. union construction context, there is more pressure to have safety training and lower ultimate cost in providing, preserving and implementing that training. As such, because in the union construction environment IIPP‐similar programs are already relatively common, government mandated and incentivized IIPPs may have a relatively smaller marginal effect on safety training and injury outcomes in these unionized areas compared to a nonunion construction setting. Table 2 reports our test of this hypothesis.
In Table 2, both mandatory IIPPs and incentivized IIPPs are entered into the model directly but also interacted with the unionization variable. This allows us to examine the effect of these regulations at varying levels of unionization. To investigate the effect of each policy at various unionization levels, we calculate the average marginal effect of each policy at representative values for unionization ranging from 5 percent to 30 percent at 5 percentage point intervals.
This calculation of average marginal effects at representative values works as follows (Williams): Using the estimated coefficients in each model (say model 1 for no‐lost‐work injuries), for each observation in the sample, four predicted values are calculated based on the estimated coefficients in the model and that observation’s actual values for each variable in the model with five exceptions. First, for the unionization rate, a representative value is selected (say 5 percent) and substituted for the actual unionization rate for each observation. Then the mandatory IIPP variable is set to either zero or one (say one), and then the insurance‐premium IIPP variable is set to either zero or one (say zero). Based on these two settings, the both‐law variable is set to zero or one (in this case zero). Then based on the union rate selected and the legal environment selected, values for the union‐law variable interaction terms are calculated. These hypothetical values are combined with the actual values in each observation to calculate a predicted injury rate for each of the sample observations. Thus, for a given unionization rate, four values are predicted for each observation corresponding to no‐law, mandatory, insurance‐reduction and both‐laws.
The foregoing calculations are repeated for additional representative unionization values ranging from 10 percent to 30 percent at 5 percentage point intervals. These calculations yield four lines bounded by confidence intervals one for each possible legal regime drawn across six levels of unionization. The gap between the no‐law line and any policy line shows the average marginal effect of that policy on the injury rate at each level of unionization. Overlapping confidence intervals between two lines indicate that the gap between the lines is not statistically significant. This procedure is then repeated for each injury rate type and these results are shown in Figure 1 through Figure 9.
Figure 1 shows predicted values for the total injury rate across six levels of unionization and four types of legal regimes. The line indicating the logged total injury rate with no IIPP policy falls as unionization rises indicating that even absent IIPP policies, (and controlling for the skill level of union and nonunion workers via differences in wage rates) the proliferation of unions, which we use as a proxy for the proliferation of IIPP‐similar training and programs, leads to a decline in the total injury rate. When either a mandatory or a quasi‐voluntary IIPP policy is found, this line relating injury rates to unionization shifts down relative to the no‐law line and the slope becomes slightly less steep. This indicates that both IIPP policies reduce construction total injury rates. The effect of each policy separately is approximately the same and the predicted values for total injury rates at various unionization levels are not statistically different comparing the two IIPP policies. For graphing convenience in Figure 1, we have only included the 95 percent confidence interval for mandatory IIPPs with the roughly similar insurance‐premium confidence interval omitted.
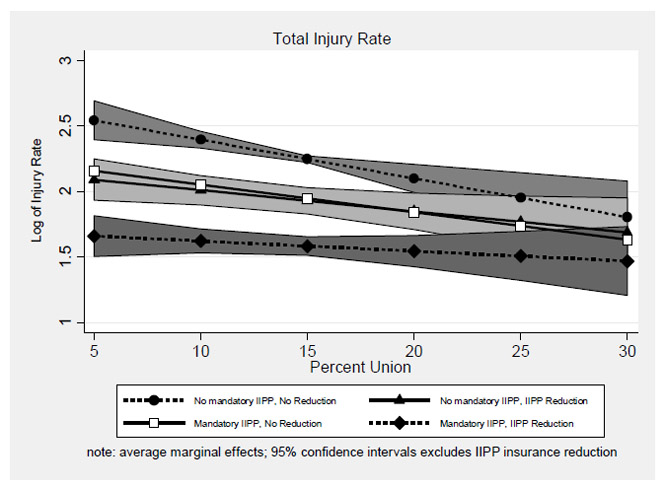
Figure 1: Predicted values for total injury rate by level of unionization and IIPP policy
Comparing the mandatory IIPP confidence interval to the “No mandatory IIPP, no reduction of insurance rate” confidence interval (hereinafter “no-law”) indicates that at high levels of unionization, we cannot be confident that IIPPs lower injury rates. But as unionization rates fall below 20, we can state with 95 percent confidence that IIPP policies in these less‐unionized environments lower total injury rates in construction.
Mandatory and insurance‐premium‐discount IIPP policies can be complementary policies. Figure 1 shows that in cases where both policies are found together, the decrease in injury rates is greater and the effect may be found at somewhat higher unionization rates. The stronger effect of the two laws together may reflect their joint impact of both compelling and encouraging participation in IIPPs. It may also reflect broader, here unmeasured compulsions, encouragement and support for IIPPs in jurisdictions that chose to enact both policies.
Figure 2 shows the effect of IIPPs on the most severe category of injuries—lost workday accidents. While the patterns are similar to total injuries, the statistical significance of IIPP policies in reducing lost‐workday injuries is found at 15 percent unionization and less. This suggests that IIPP‐similar policies associated with unionization are more effective relative to reducing severe injuries leaving less space for the introduction of IIPPs to reduce severe injuries in more heavily unionized construction.
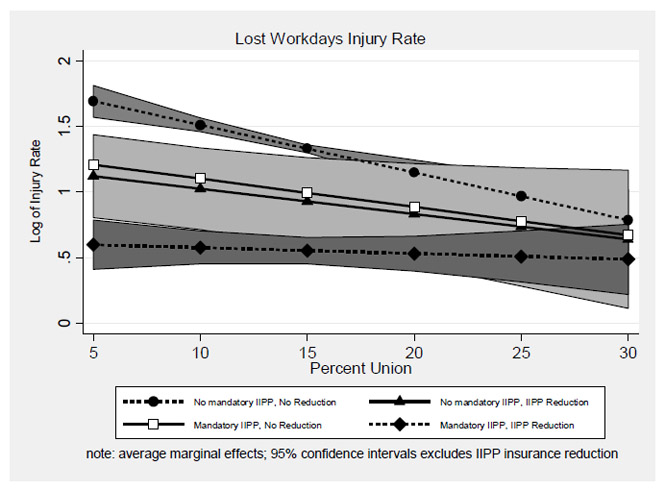
Figure 2: Predicted values for lost workday injury rate by level of unionization and IIPP policy
Figure 3 shows that when no‐law jurisdictions are compared to both‐law jurisdictions, there is a statistically significant effect of the joint policies at all but the highest level of unionization. Again, the stronger effect of the both‐law regime may reflect an additive effect of the two policies or it may be an artifact of unmeasured additional enforcement of or involvement with IIPPs in those jurisdictions.
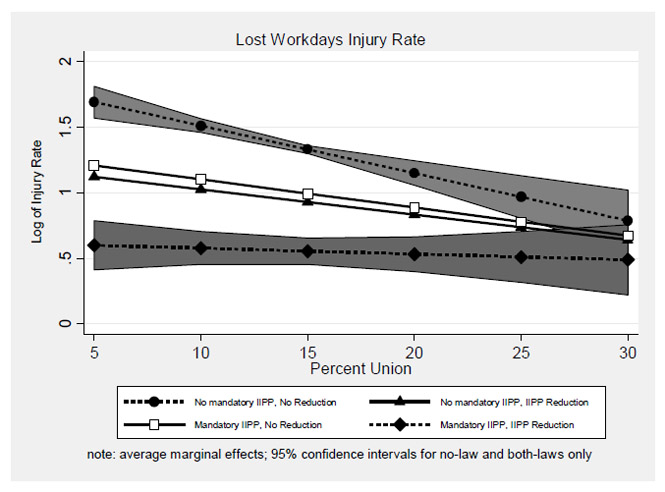
Figure 3: Predicted values for lost-workday injury rates by level of unionization and IIPP policy comparing no-law to both-laws
Figure 4 and Figure 5 present the lost‐work injury case with results quite similar to the days‐away injury rate. Each policy on its own lowers lost work injury rates at a 25 percent unionization rate and below (Figure 5) and when found together, mandated and quasi‐voluntary IIPP policies reduce lost‐work injuries at all but the highest levels of unionization and the effect grows as unionization rates fall.
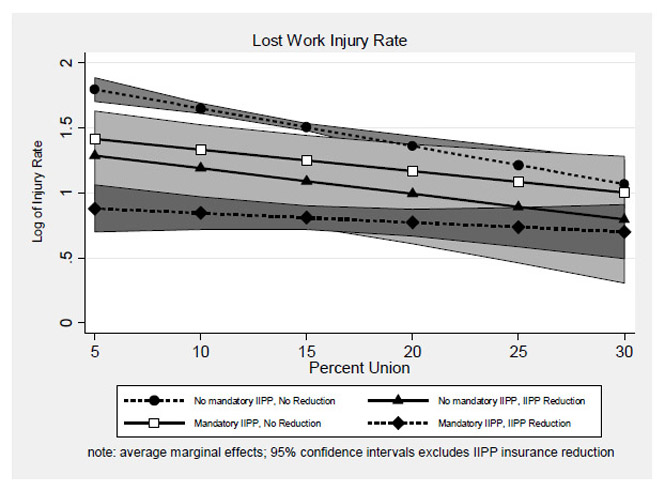
Figure 4: Predicted values for lost-work injury rates by level of unionization and IIPP policy
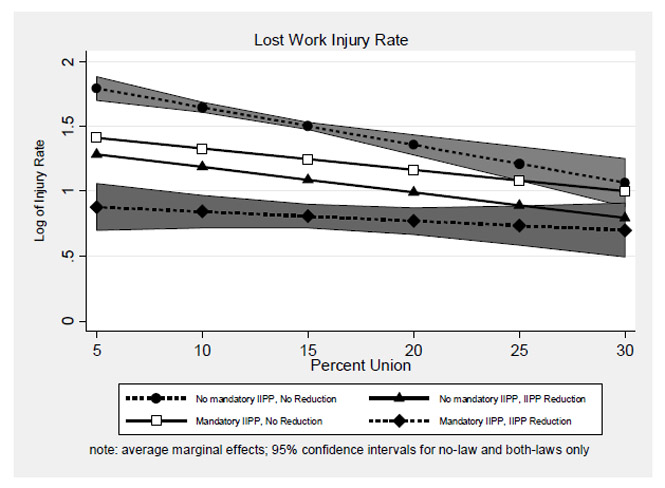
Figure 5: Predicted values for lost-work injury rates by level of unionization and IIPP policy comparing no-law to both-laws
In contrast, Figure 6 shows that light‐duty injury rates do not reveal a statistically significant pattern of injury rate across unionization rates and with the introduction of IIPPs either singularly or jointly. We interpret this as an accident-distribution‐shift effect where IIPPs not only lower more severe injury rates but also reduce injury severity inducing a shift in accidents into the light‐duty category where they pool up. The contrasting currents of a safer worksite reducing injury rates and making injuries milder in the case of light‐duty injuries seem to be obscuring IIPP effects in the case of light‐duty injuries.
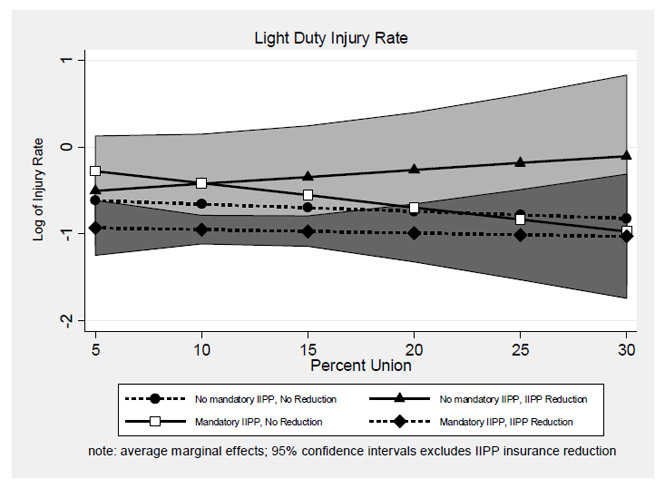
Figure 6: Predicted values for light-duty injury rates by level of unionization and IIPP policy
The pattern found for total, lost‐workday and lost‐work injuries re‐emerges in the case of no‐lost‐work injuries (Figure 7). IIPPs lower injuries relative to no‐law jurisdictions. The IIPP impact is greater at lower levels of unionization. But statistical significance between law and no‐law no‐lost‐work injury‐rates is only found where mandatory and quasivoluntary regulations are found together (Figure 8). We attribute this weaker IIPP effect to the cascading of injury-distribution shifting. This downward shift in the severity of injuries associated with IIPP policies can be seen in Figure 9.
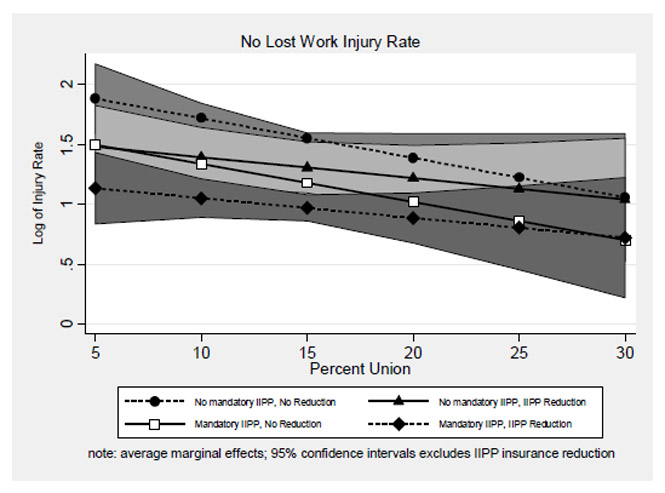
Figure 7: Predicted values for no-lost-work injury rates by level of unionization and IIPP policy
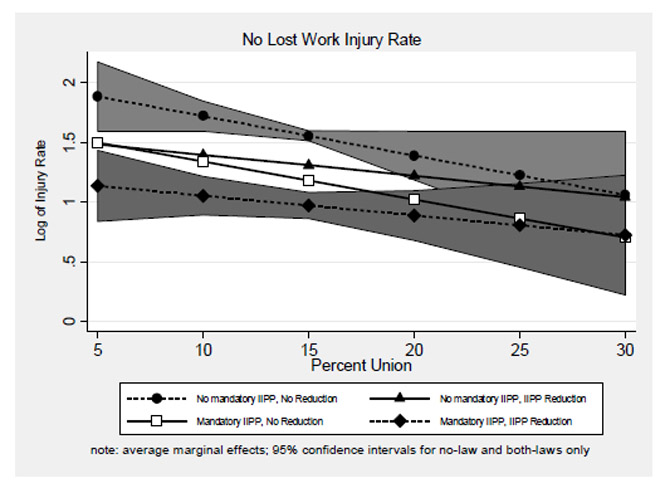
Figure 8: Predicted values for no‐lost‐work injury rates by level of unionization and IIPP policy comparing no-law to both-laws
Figure 9 shows all four legal environments and provides the 95 percent confidence intervals for the no-law and both-laws legal environment. Falling injury rates with rising unionization rates is found for all but the light duty injury rate category and is consistent with the conclusion that the presence of union workers reduces injuries and shifts the distribution of injuries towards milder categories. This phenomenon may be due to better safety training among union construction workers. Scanning from the lower-right-hand panel corresponding to the most severe injury rate, lost workdays, to progressively less severe injury rates, the measured effect of IIPPs are reduced with the least effect shown in light‐duty work and the IIPP effect re‐emerging in weaker form in the least severe no‐lost‐work category. This pattern is consistent with an interpretation where IIPPs both reduce the number of accidents on construction worksites and make accidents that do occur milder. Again with the exception of light‐duty work, the IIPP effect is strongest when the two policies are combined while IIPP policies have lower marginal effects on injuries where unionization is higher.
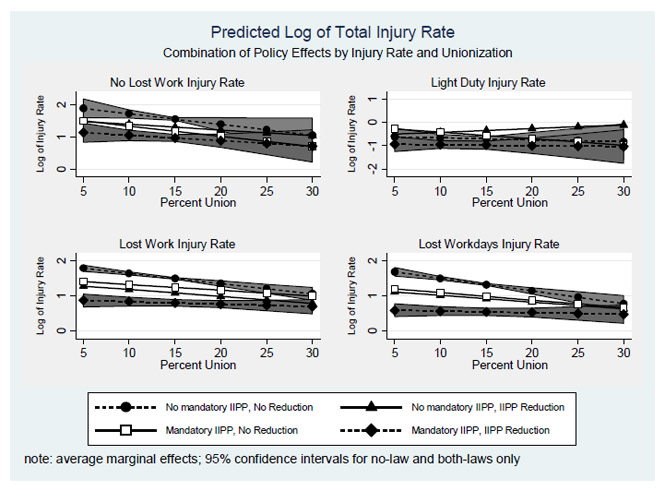
Figure 9: Predicted values for four types of injury rates compared by level of unionization and IIPP policy
At the lowest level of statewide construction unionization (5 percent), for the most severe lost workday injuries, model 4 in Table 2 predicts a days-away-from-work injury rate of 5.4 for jurisdictions with no IIPP laws and a 5 percent unionization rate. For states with a mandatory IIPP policy but no IIPP insurance incentives, the model predicts 1.2 days-away injuries per 100 full‐time equivalent construction workers in a 5 percent unionization environment. For states with IIPP insurance incentives but no mandatory IIPP in a 5 percent union environment, the model predicts a 1.1 injury rate. And for the same 5 percent unionization but both IIPP policies, the model predicts a 0.6 severe injury rate. These are reductions in injury rates relative to no IIPP laws in low union environments of 38, 43 and 66 percent respectively.
OSHA claims that for employers who adopt IIPPs, injuries fall by 15 to 35 percent from pre‐IIPP levels. OSHA estimates that overall injury rates across all industries and across all employers including both those who have had and those who previously have not had IIPPs, would fall by 12.4 percent. Why do we estimate higher injury reductions compared to OSHA? First, construction is a more dangerous industry compared to most. It may well be that IIPPs are more effective in percentage terms where safety risks are higher. Second, we calculated percentage changes in injury rates for the most severe injuries which correspondingly benefit the most not only from a reduction in accidents but also in accident‐distribution shifting downward towards less severe injury categories. In the case of no‐lost‐work, model 1 predicts a 33, 32 and 52 percent drop in these mild injuries with the adoption of mandatory, quasi‐voluntary and both IIPP policies respectively. Third, these dramatic predictions are for low levels of unionization. At high levels of unionization, our models predict injury rate declines tied to IIPP implementation that are either modest or nonexistent. OSHA’s prediction of an overall injury rate decline of 12 percent is across all industries and the range of pre‐existing voluntary IIPPs and IIPP‐similar practices. Thus, by focusing on nonunionized construction, we have identified a segment of the economy where IIPPs are most likely to generate a dramatic improvement in workplace safety.
Limitations
Analysts of U.S. workplace safety practices and policies face a dilemma. Research can focus on case studies where rich detail regarding safety practices and outcomes are available but the challenge of generalizing from specific cases remains. Alternatively, analysts can pursue state‐level analysis of injury rates where generalizing from past experience is more feasible but empirical work is haunted by the confounding influence of potentially changing reporting culture. While we have attempted to control for changing under‐reporting in our data, the skeptical reader may not be convinced that we have succeeded. Many of the interpretations of our results might be recast not as improvements in actual safety but as artifacts of increased under‐reporting and misclassification. More work needs to be done in improving our ability to control for these phenomena.
Cross‐state safety policy analysis continually confronts the difficulty of measuring variations in enforcement and compliance. We were surprised at the strength of our results when mandatory and quasi‐voluntary IIPPs were combined. While we have interpreted this as both an additive effect of the two policies and as a sign of environments where there is greater compliance and enforcement, we have no direct measures of enforcement to test this interpretation. Further work is needed to quantify the enforcement, compliance and involvement of contractors and workers in IIPPs to better measure actual from paper implementation of IIPP policies.
Conclusion
Construction workplace injuries have fallen for decades, yet construction remains one of the most dangerous major industries in the U.S. The cost of injuries in terms of project interruption, workers’ compensation costs and personal suffering remain high. Despite OSHA’s enthusiasm regarding the benefits of mandated and quasi‐voluntary IIPPs, some knowledgeable observers doubt that mandatory IIPPs will have the anticipated benefit. The primary cause for this doubt is the lack of a scientific literature at the state‐level of analysis that adequately controls for confounding factors including changes in reporting culture. Critics assert that there is an absence of proper tests of the effectiveness of policy mandated IIPPs. Here we seek to help build that literature.
Focusing on the construction industry and parsing the construction labor market into less and more unionized segments, we conclude with much optimism that mandated and quasi‐voluntary IIPPs will substantially improve safety in the nonunionized sector of construction. This improvement will come both from lowering injury rates and from transforming accidents from more serious injuries to less serious injuries. While more efforts are needed to improve statistical controls for the effects of changes in reporting culture and variations in compliance and enforcement, the substantial safety benefits found here particularly for more serious injuries and particularly in more nonunionized environments are likely to persist even with more accurate controls for variations in reporting and enforcement. We have shown that collective bargaining in construction is an effective alternative to government mandated IIPPs in promulgating better safety culture. However, with the ongoing decline of unions in construction, mandated and quasi‐voluntary IIPPs have an increasing role to play in promoting construction safety.
References
Alsop, P. & LeCouteur, M. (1999). Measurable success from implementing an integrated OHS management system at Manningham City Council. Journal of Occupational Health & Safety – Australia & New Zealand, 15, 565–572.
Angello, J. (2010). A journey to improved safety performance. The Leader, 19(3), 27‐29.
Azari‐Rad, H., Philips, P., Prus, M. (2002). Making Hay When It Rains: The Effect Prevailing Wage Regulations, Scale Economies, Seasonal, Cyclical and Local Business Patterns Have On School Construction Costs. Journal of Education Finance, 27(4) 997‐1012.
Bilginsoy, C. (2003). The Hazards of Training: Attrition and Retention in Construction Industry Apprenticeship Programs. Industrial and labor Relations Review, 57(1) 54‐67.
Byler, C.G. (2013). Hispanic/Latino fatal occupational injury rates. Monthly Labor Review. February 2013, 14‐23.
Bunn, W. B. et al. (2001). Health, safety, and productivity in a manufacturing environment. Journal of Occupational and Environmental Medicine 43(1), 47-55.
Census, (2000). U.S. Census Bureau. Bridge Between SIC and NAICS, SIC: construction industries. http://www.census.gov/epcd/ec97brdg/E97B2_17.HTM (last accessed May 14, 2014).
Cigularov, K.P., Lancaster, P.G., Chen, P.Y., Gittleman, J., Haile, E. (2013). Measurement equivalence of a safety climate measure among Hispanic and White Non‐Hispanic construction workers. Safety Science, 54, 58‐68.
Conference Board (2003). Driving toward “0”: Best practices in corporate safety and health.
CPWR Center for Construction Research and Training (2013). The Construction Chart Book, The U.S. Construction Industry and Its Workers, Fifth Edition.
Donado, A. (2013). Why Do Unionized Workers Have More Nonfatal Occupational Injuries? University of Heidelberg, Department of Economics, Discussion Paper Series No. 551. http://ssrn.com/abstract=2367448 or http://dx.doi.org/10.2139/ssrn.2367448 (last accessed May 15, 2014).
Dong X, Platner J.(2004). Occupational fatalities of Hispanic construction workers from 1992 to 2000. American Journal of Industrial Medicine. 45, 45‐54.
Dong, X.S., Wang, X., Daw, C. (2010). Fatal and Nonfatal Injuries among Hispanic Construction Workers, 1992‐2008 (2010). CPWR Data Brief. 2(2).
Dong, X.S., Wang X., Daw, C. (2012). Fatal Falls Among Older Construction Workers. Human Factors: The Journal of the Human Factors and Ergonomics Society. 54(3) 303‐315.
Engineering News Record (1977 to 2008). Compensation Insurance Base Rates.
Marion Gillen M., Baltz B., Gassel M., Kirsch L., Vaccaro, D. (2002). Perceived safety climate, job demands, and coworker support among union and nonunion injured construction workers. Journal of Safety Research, 33(1) 33‐51.
Glover, R.W., Bilginsoy, C. (2005). Registered apprenticeship training in the U.S. construction industry. Education and Training, 47(4/5) 337‐349.
Goodman, C.J., Mance, S.M., (2011). Employment loss and the 2007‐09 recession: an overview. Monthly Labor Review, April 3‐12.
Hasle, P. & Limborg, H. (2006). A review of the literature on preventive occupational health and safety activities in small enterprises. Industrial Health 44(1), 6‐12.
Huang, Y. H. et al. (2006). Safety climate and self‐reported injury: Assessing the mediating role of employee safety control. Accident Analysis and Prevention 38(3), 425‐33.
Huang, Y. H. et al. (2009). Financial decision‐makers’ views on safety: What SH&E professionals should know. Professional Safety (April), 36‐42.
Kim, J., Philips, P. (2010). Health Insurance and Worker Retention in the Construction Industry. Journal of Labor Research, 31 20‐38.
D. Langford, D., Rowlinson. S., Sawacha, E. (2000). Safety behaviour and safety management: its influence on the attitudes of workers in the UK construction industry. Engineering Construction and Architectural Management, 7(2) 133‐ 140.
LaTourrette, T., Mendeloff, J. (2008). Mandatory Workplace Safety and Health Programs, Implementation, Effectiveness and Benefit‐Cost Trade‐offs. Rand, Center for Health and Safety in the Workplace, Technical Report.
Lewchuk, W., Robb, A., & Walters, V. (1996). The Effectiveness of Bill 70 and Joint Health and Safety Committees in Reducing Injuries in the Workplace: The Case of Ontario. Canadian Public Policy, 22, 225‐243.
Mendeloff, J., Burns R., Fan X., Kopsic, J. and Xia, J. (2011). Is Louisiana Really the Safest State? Comparing Fatal and Non‐ Fatal Injury Rates Across States in Construction. Santa Monica, Calif.: Rand Corporation, unpublished research, 2011.
Mendeloff, J., Gray, W.B., Haviland, A.M., Main, R., Xia, J. (2011). An Evaluation of the California Injury and Illness Prevention Program. Rand, Center for Health and Safety in the Workplace, Technical Report.
OSHA, (1998). Preliminary Analysis of Effectiveness of Safety and Health Programs.
OSHA, (2012). U.S. Department of Labor, Occupational Safety and Health Administration. Injury and Illness Prevention Programs, White Paper.
Robinson J.C., Shor, G.M. (1989). Business‐cycle influences on work‐related disability in construction and manufacturing. The Milbank Quarterly 67(2) 92‐113.
Robson, L.S., Clarke, J.A., Cullen, K., Bielecky, A., Severin, C., Bigelow, P.L., Irvin, E., Culyer, A., Mahood, Q. (2007). The effectiveness of occupational health and safety management system interventions: A systematic review. Safety Science 45, 329‐353.
Sawacha, E., Naoum, S., Fong, D. (1999). Factors affecting safety performance on construction sites. International Journal of Project Management 17( 5) 309‐315.
Smitha, M. W., Katharine A. Kirk, K.A., Kent R. Oestenstad, K.R., Kathleen C. Brown, K.C. and Seung‐Dong Lee, S. (2001) Effect of State Workplace Safety Laws on Occupational Injury Rates. Journal of Occupational and Environmental Medicine 43(12), 1001–1010.
Stanford University. (1981). Improving construction safety performance: The user's role (Technical report No. 260). Department of Civil Engineering.
Siu, O., Phillips, D.R., Leung, T. (2003). Age differences in safety attitudes and safety performance in Hong Kong construction workers. Journal of Safety Research, 34(2) 199‐205.
Torp, S. et al. (2000). Systematic health, environment, and safety activities: Do they influence occupational environment, behavior and health? Occupational Medicine, 50(5), 326‐333.
Williams, R. Using the margins command to estimate and interpret adjusted predictions and marginal effects. Stata Journal. 12(2) 308‐331. http://irlee.umich.edu/Publications/Docs/RightToWorkLawsAndFatalitiesInConstruction.pdf (last accessed May 14, 2014).
Yassi, A. (1998). Utilizing Data Systems to Develop and Monitor Occupational Health Programs in a Large Canadian Hospital. Methods of Information and Medicine, 37, 125‐129.
Footnotes
1 A slightly earlier review of a related literature (Robson et al. 2007) on occupational health and safety management systems (OHSMS) interventions yields conclusions similar to LaTourrette and Mendeloff: Robson et al. concluded that due to the limited number of studies, the heterogeneity of circumstances studied, weak methodological quality and lack of generalizability, the literature as of 2005 cannot either support or oppose OHSMS interventions. With respect to small firms, Hasle and Limborg (2006) found that the literature had thus far failed to evaluate the effect or practicality of preventative health and safety programs.
2 Originally, this equation was weighted by the number of employed construction workers in each state in each year as follows: (yijt*√njt) = (a,*√njt) + (βijtxijt*√njt) + (βijtxijt*√njt) + (uijt*√njt) In addition, to adjust for the cross‐sectional heteroskedasticity and serial correlation in this panel data, the Huber‐White sandwich VCE estimator was used.
3 In semi‐log linear regressions where the dependent variable is a natural log and the independent variable is measured in units, a 1 unit change in the independent variable results in a percentage change in the underlying non‐logged dependent variable. The percentage change in Y is calculated as %chgY = 100*(exp(B)‐1) where B is the estimated coefficient of X and exp(B) is the exponent of B. For smaller Bs close to zero, the estimated coefficient is approximately the same as the percentage change. As B rises, the actual percentage change diverges below the reported coefficient according to the above formula.
Tables
t statistics in parentheses; * p < 0.05, ** p < 0.01, *** p < 0.001
© 2014, CPWR – The Center for Construction Research and Training. CPWR, the research and training arm of the Building and Construction Trades Dept., AFL-CIO, is uniquely situated to serve construction workers, contractors, practitioners, and the scientific community. This report was prepared by the authors noted. Funding for this research study was made possible by a cooperative agreement with the National Institute for Occupational Safety and Health, NIOSH (OH009762). The contents are solely the responsibility of the authors and do not necessarily represent the official views of NIOSH or CPWR.