
An Analysis of Fatal Events in the Construction Industry 2003
Summary Statement
Descriptions of the 707 fatal events inspected by OSHA resulting from accidents which occurred in construction during calendar year 2003.
Jan 2005
| This report covers only a portion of the deaths in the construction industry in 2003. This report is based upon OSHA-inspected fatal events in construction during calendar 2003. The data analyzed were provided by Dr. Joseph Dubois, Director, Office of Statistics, Occupational Safety and Health Administration. William R. Schriver, Ph.D., and Thomas E. Cressler II, M.S., Resource, conducted the study and prepared this report; they alone are responsible for all interpretations, conclusions and any errors found in the report. |
Office of Statistics
Occupational Safety and Health Administration
U. S. Department of Labor
Prepared by:
Construction Industry Research and Policy Center
University of Tennessee, Knoxville
January 2005
This report is based upon OSHA-inspected fatal events in construction during calendar 2003. The data analyzed were provided by Dr. Joseph Dubois, Director, Office of Statistics, Occupational Safety and Health Administration. William R. Schriver, Ph.D., Director and Thomas E. Cressler II, M.S., Senior Associate Administrator, conducted the study and prepared this report; they alone are responsible for all interpretations, conclusions and any errors found in the report.
Executive Summary
OSHA inspected 707 fatal construction incidents (excluding non-work related causes), involving 730 fatalities, in calendar year 2003. Five of the 30 proximal causes classified in this report accounted for 296 (41.9 percent) of the fatal events investigated. They were: (1) Falls from/through Roofs: 76 events (10.7 percent); (2) Falls from/with Structures: 74 events (10.5 percent); (3) Crushed/Runover of Non-Operator of Construction Equipment: 56 events (7.9 percent); (4) Electrocution by Equipment Contacting Energized Wire: 47 events (6.6 percent); and (5) Electrocution from Equipment Installation/Tool Use: 43 events (6.1 percent).
A comparison of the year-to-year ranks of the proximal causes during the 1991-2003 period shows that they are highly and significantly correlated, i.e., the individual ranks of the causes vary very little from year-to-year.
Most of the fatal events involved a single victim, but 18 (2.5 percent) of the events were multi-fatality events which accounted for 41 (5.6 percent) of the fatalities.
Other findings were: (1) in 433 (61.2 percent) of the fatal events the victim was judged to be the primary initiator of the cause; in 153 events (21.6 percent) another employee was judged to be the primary initiator of the cause; in 16 events (15.6 percent) the victim was judged to be simply in the wrong place at the wrong time; and the remaining 11 events (1.6 percent) could not be classified; (2) in 511 of the events (72.3 percent) the victim was judged to be performing work at the task site when injured; in 161 events (22.8 percent) the victim was judged to be entering, leaving or away from their task site when injured; and in 35 events (5.0 percent) no classification was possible; and (3) most fatal events happened on Mondays with 148 (20.9 percent) events occurring that day of the week, followed by Wednesdays with 146 (20.6) occurring that day; and most fatal events happened between the 13:00 and 14:00 hours (1:00 pm and 2:00 pm) with 81 (11.5 percent) events occurring during this time interval, followed by 11:00 to 12:00 and 14:00 to 15:00 time periods with 76 (10.7) events occurring in each of these periods.
Table of Contents
Introduction
Data
Analysis of Fatal Events by Cause
Analysis by Victim’s Situation
Analysis of Fatal Events by Day of Week and by Time
List of Tables in Text
Table 1. Construction Fatality Event Causes, 2003
Table 2. A Comparison of Ranks of Causes of Fatal Events in
1991 – 2002 with 2003
Table 3. Distribution of Fatal Construction Events by Day of Week
Table 4. Distribution of Fatal Construction Events by Hour
Appendices
Appendix A:
Definitions of Fatality Causes
Appendix B:
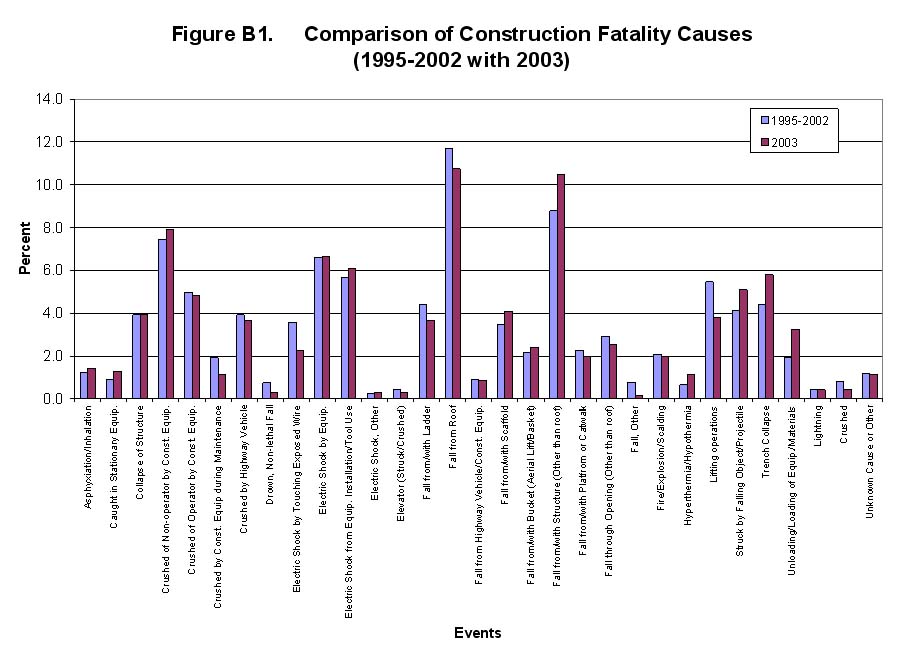
Figure B1. Comparison of Construction Fatality Causes (Pooled Years 1995-2002 with 2003)
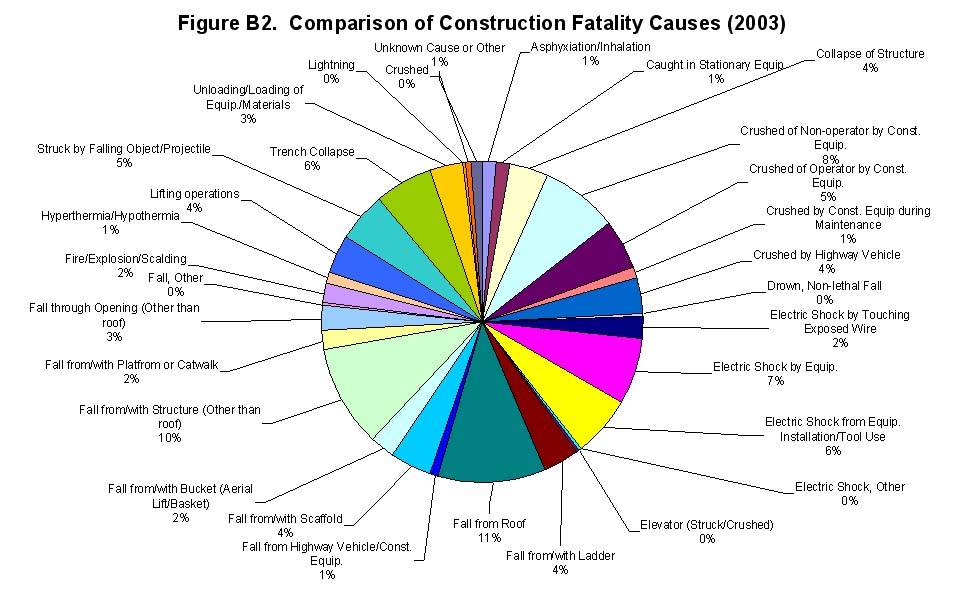
Figure B2. Frequency of Causes of Construction Fatality Events (2003)
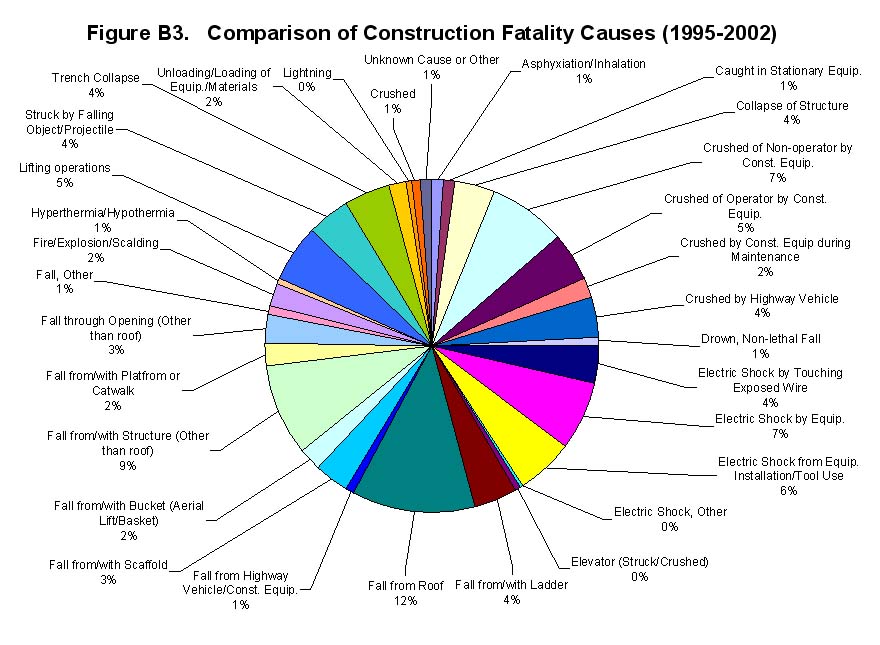
Figure B3. Frequency of Causes of Construction Fatality Events (1995–2002)
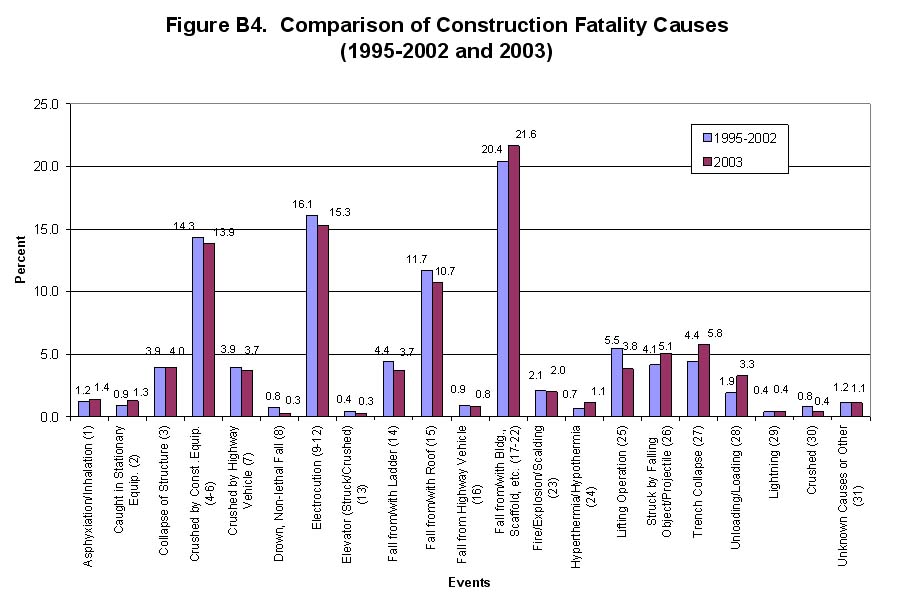
Figure B4. Comparison of Construction Fatality Causes - Combined Categories (Pooled Years 1995-2002 with 2003)
Table C1. Construction Fatal Events by End-Use Type, 2003
Table C2. Construction Fatal Events by Type of Project, 2003
Table C3. Construction Fatal Events by Four-Digit SIC, 2003
Table C4. Construction Fatal Events by Project Value, 2003
Table C5. Construction Fatalities by Construction Operation, 2003
I. Introduction
This paper reports on the causes of fatal events in the construction industry which occurred in calendar year 2003. Nine earlier studies1 by the Construction Industry Research and Policy Center (CIRPC) analyzed the causes of fatal events in this industry in 1991-1992, 1993-1994, 1995, 1996, 1997, 1998, 1999, 2000, 2001 and 2002.
II.
Data
The data analyzed in this report, provided by OSHA from Form 170’s, consist of narrative descriptions of the 707 fatal events inspected by OSHA resulting from accidents which occurred in construction during calendar year 2003. The Occupational Safety and Health Act of 1970 provides States with the option of administrating the Act themselves or accepting Federal administration of the Act. Twenty-nine States and the District of Columbia chose administration under the Federal System, and the remaining 21 States and two Territories chose self-administration under State Plans2.
In this report, as in earlier reports, analysis includes all OSHA-inspected fatal construction accidents regardless of Federal or State administration.
Also, as in the earlier studies, non-accidental fatalities on construction sites or contractor yards (such as deaths from non-work related heart attacks, strokes, seizures, etc.) and fatalities of construction workers killed off-site in traffic accidents were excluded from the analysis; these fatalities accounted for about 3 percent of OSHA-inspected fatal construction events in 1991-2002 but about 5 percent in 2003. Although the Occupational Safety and Health Act of 1970 requires employers to report fatalities to OSHA within eight hours of the occurrence of the event, all fatalities on construction sites are not inspected by OSHA; for example, OSHA does not inspect fatal construction events involving independent contractors with no employees. Therefore, the results reported upon here do not provide a year-to-year analysis of changes in the absolute number of fatal events or individuals killed on construction sites.Each narrative record typically consists of a brief description of the event leading to the fatality, although this is not always the case. Where the narrative description was omitted, inconclusive or completely unclear the event cause was coded “unknown cause or other”; otherwise each narrative was analyzed and classified into one of 31 cause categories, although a great deal of collective judgment was often required to classify the cause of many of the accidents.
This report also includes the following classification of each fatal event according to coding by the OSHA compliance officer who investigated the accident: (1) type of construction (new or addition, alteration or rehabilitation, maintenance or repair, demolition, other); (2) estimate of total project value (seven dollar-value categories beginning with “under $50,000” and ending with “$20,000,000 and over”); (3) 17 end-use categories, such as “single-family housing,” “multi-family building,” “commercial building,” “street or highway,” etc.; and (4) the construction operation being performed that caused the fatal event (selected from a list of construction operations such as “backfilling and compacting,” “cutting concrete pavement,” “erecting structural steel,” “installing equipment (HVAC and other,” etc.). However, CIRPC’s review of over 1200 case files of fatal construction events occurring in 1997, 1998 and 1999 revealed that coded data for an event were sometimes internally inconsistent or did not comport with corresponding narrative descriptions. Consequently, the data analyzed in this report are restricted to the direct causes of the fatal events where the authors were able, in most cases, to classify the events with relative certainty according to 31 types of causes, essentially the same types as were used in CIRPC’s previous fatality studies. However, coded data are included in Appendix C for the following: (1) end-use of structure; (2) type of construction; (3) occupation of the victim(s); (4) contract value of the construction project; and (5) construction operation associated with the fatality.
In classifying the events a rule of primacy was followed for multiple-cause fatalities (representing less than 1 percent of the fatality events in this study and the earlier studies cited): the first cause in the chain of causes was recorded as the cause of the fatal event. Definitions of the causes are shown in Appendix A
III. Analysis of Fatal Events by Cause
-
A. Distribution of Fatal Events by Cause
Table 1. Construction Fatality Event Causes, 2003
Number of Events and Victims |
||||
Event Causes |
Description |
Events |
Victims |
Percent of Events |
1. |
asphyxiation/inhalation of toxic vapor | 10 |
12 |
1.4 |
2. |
caught in/struck by stationary equipment | 9 |
9 |
1.3 |
3. |
crushed from collapse of structure | 28 |
31 |
4.0 |
4. |
crushed/run-over of non-operator by operating construction equipment | 56 |
56 |
7.9 |
5. |
crushed/run-over/trapped of operator by operating construction equipment | 34 |
34 |
4.8 |
6. |
crushed/run-over by construction equipment during maintenance/modification | 8 |
8 |
1.1 |
7. |
crushed/run-over by highway vehicle | 26 |
26 |
3.7 |
8. |
drown, non-lethal fall | 2 |
2 |
0.3 |
9. |
electric shock by touching exposed wire | 16 |
16 |
2.3 |
10. |
electric shock by equipment contacting power source | 47 |
55 |
6.6 |
Event |
Percent |
|||
| a. | ladder | 9 |
1.3 |
|
| b. | scaffold | 2 |
0.3 |
|
| c. | crane/lifting equipment/boom/dump truck | 24 |
3.4 |
|
| d | contact while handling materials such as gutters, iron rods, etc. | 12 |
1.7 |
11. |
electric shock from equipment installation/tool use | 43 |
43 |
6.1 |
12. |
electric shock, other | 2 |
2 |
0.3 |
13. |
elevator (struck/crushed by elevator or counter weights) | 2 |
2 |
0.3 |
14. |
fall from/with ladder: includes collapse/fall of ladder | 26 |
27 |
3.7 |
15. |
fall from/through roof | 76 |
76 |
10.7 |
16. |
fall from highway vehicle/construction equipment | 6 |
6 |
0.8 |
17. |
fall from/with scaffold | 29 |
29 |
4.1 |
18. |
fall from/with bucket (aerial lift/basket) | 17 |
18 |
2.4 |
19. |
fall from/with structure (other than roof) | 74 |
78 |
10.5 |
Event |
Percent |
|||
| a. | fall with collapse of structure | 18 |
2.5 |
20. |
fall from/with platform or catwalk | 14 |
14 |
2.0 |
21. |
fall through opening (other than roof) | 18 |
18 |
2.5 |
22. |
fall, other or unknown | 1 |
1 |
0.1 |
23. |
fire/explosion/scalding | 14 |
15 |
2.0 |
24. |
hyperthermia/hypothermia | 8 |
8 |
1.1 |
25. |
hit, crushed, fall during lifting operations | 27 |
27 |
3.8 |
26. |
struck by falling object/projectile (including tip-overs) | 36 |
38 |
5.1 |
27. |
crushed/suffocation from trench collapse | 41 |
42 |
5.8 |
28. |
crushed while unloading-loading equipment/material (except by crane) | 23 |
23 |
3.3 |
29. |
shock/burn from lightning | 3 |
3 |
0.4 |
30. |
crushed other | 3 |
3 |
0.4 |
31. |
unknown cause or other | 8 |
8 |
1.1 |
707 |
730 |
100.00 |
At the risk of misleading the reader by over generalizing, it may be informative to describe frequently occurring specific examples of situations leading to the 10 most frequent causes of fatal events listed in Table 1.
Falls from /with/through Roofs. An inattentive roofer or laborer without fall protection walks backward and off the roof or steps into a skylight opening or on to a covered skylight opening.
Falls from/with Structures. An ironworker without fall protection slips or loses balance while erecting steel frame and falls or a carpenter or an ironworker falls as a result of a collapsing structure or structural component (24.3 percent of falls from/with structures were caused by collapses.)
Crushed, Run-over, Non-operator. A laborer guiding trucks while backing up, a grade checker or a laborer performing site clean-up in proximity of excavating machinery is run-over after getting out of the line-of-sight of an operator/driver.
Equipment Contacting Electric Line. Lifting equipment, such as a crane or lull, or a ladder is positioned into an overhead electric line resulting in the electrocution of the worker who becomes a ground.
Electrocution. An electrician, helper or lineman working “hot” inadvertently contacts an energized source by body, uninsulated tool or jumper.
Trench Collapse. A laborer or pipelayer is working in an unprotected trench (without sloping, shoring or trench box) and a trench wall collapses, killing the worker.
Struck by Falling Object/Projectile. There were a wide variety of situations in which this type of event occurred, and no typical pattern was evident. Examples of situations were: struck by nails from nail guns, struck by cap on a pressurized line, debris falling during demolition, equipment falling from roof and falling trees.
Crushed/Run-over…Operator. Mobile construction equipment, such as dozers and fork lifts, goes over an embankment and rolls over or rolls over when encountering uneven terrain, resulting in the crushing of the operator. (The operator may be crushed inside the equipment or crushed by the equipment while trying to escape.)
Fall from/with scaffold. Guard rails not in place and worker loses balance, loose floorboards, worker slips on entry or exit and scaffold falls during assembly or disassembly.
Crushed from collapse of structure. Building wall collapses due to wind, overload or nearby work activity including demolition.
The number of victims killed by each cause is also shown in Table 1 where it can be seen that in most events only one worker was killed per event. There were 21 fatality causes where no event had multiple fatalities; only 9 fatality causes included events with multiple fatalities. “Asphyxiation/inhalation of toxic vapors” was the fatality cause which had the most victims killed per event, i.e., 10 events and 12 victims or 1.2 victims per event.
The Bureau of Labor Statistics (BLS) reported that during 1995-1999, 4 percent of all fatal work-related events involved multiple fatalities, and these multiple-fatality events accounted for 10 percent of the workers killed during the period. They averaged three fatalities per incident4.
The OSHA data for construction fatalities in 2003 show that 2.5 percent of the fatal events had multiple fatalities, and they accounted for 5.6 percent of the individuals killed. The multiple-fatality construction incidents averaged 2.3 fatalities per incident. It should be noted that the BLS data included homicides, and they accounted for 19 percent of their multi-fatality incidents. Homicides were excluded from the analysis of OSHA data, but they were all single-fatality events.
Table 2 shows a comparison of the ranks of the causes in 2003 with the average rank of the causes of fatal events during the period 1991 - 2002. It can be seen that the overall rank pattern of the causes in 2003 is very similar to the rank pattern in 1991 – 2002. An overall statistical comparison of the correlation of the rank in 2003 with the average rank in 1991-2002 was calculated using a Spearman rank correlation procedure5. The correlation obtained was + .93, p < .001, indicating that the ranks of the causes in the two time periods are highly and positively correlated, i.e., did not change significantly between 1991 – 2002 and 20036. Since averaging the 1991 – 2002 ranks removed inter-year variance; a somewhat lower correlation would be expected between 2002 and 2003 ranks of causes, i.e., a measure of the short-term cycle as opposed to a longer-term trend. The Spearman rank-order correlation between 2002 and 2003 causes was calculated and found to be + .93, p < .001, indicating that the 1991-2001 pattern changed very little between 2002 and 2003.
The correlation result is not surprising given that the general composition of construction output, and therefore the mix of construction operations required to produce the output, was probably very similar during the time periods examined. This interpretation implies that the rank of a cause is a function of the magnitude of exposure to the cause and/or the inherent danger associated with the cause.
Table 2. Comparison of Ranks of Causes of Fatal Events in 1991 - 2001 with 2002
1991-2002 Average |
2003 |
|||||
| Event | Number |
Percent |
Rank |
Number |
Percent |
Rank |
| 1. asphyxiation/inhalation of toxic vapor | 7.3 |
1.2 |
22 |
10 |
1.4 |
21 |
| 2. caught in/struck by stationary equipment | 5.8 |
0.9 |
24 |
9 |
1.3 |
22 |
| 3. crushed from collapse of structure | 25.7 |
4.1 |
10 |
28 |
4.0 |
10 |
| 4. crushed/run-over of non-operator by operating construction equipment | 47.8 |
7.7 |
3 |
56 |
7.9 |
3 |
| 5. crushed/run-over/trapped of operator by operating construction equipment | 32.7 |
5.3 |
6 |
34 |
4.8 |
8 |
| 6. crushed/run-over by construction equipment during maintenance /modification | 12.6 |
2.0 |
20 |
8 |
1.1 |
23 |
| 7. crushed/run-over by highway vehicle | 24.2 |
3.9 |
13 |
26 |
3.7 |
12 |
| 8. drown, non-lethal fall | 5.8 |
0.9 |
23 |
2 |
0.3 |
27 |
| 9. electric shock by touching exposed wire | 25.1 |
4.0 |
11 |
16 |
2.3 |
17 |
| 10. electric shock by equipment contacting power source | 45.8 |
7.4 |
4 |
47 |
6.6 |
4 |
| 11. electric shock from equipment installation/tool use | 29.6 |
4.7 |
7 |
43 |
6.1 |
5 |
| 12. electric shock, other | 4.4 |
0.7 |
27 |
2 |
0.3 |
27 |
| 13. elevator (struck/crushed by elevator or counter weights) | 2.8 |
0.5 |
29 |
2 |
0.3 |
27 |
| 14. fall from/with ladder: includes collapse/fall of ladder | 25.8 |
4.1 |
9 |
26 |
3.7 |
12 |
| 15. fall from/through roof | 70.9 |
11.4 |
1 |
76 |
10.7 |
1 |
| 16. fall from highway vehicle/construction equipment | 5.3 |
0.9 |
25 |
6 |
0.8 |
25 |
| 17. fall from/with scaffold | 20.6 |
3.3 |
14 |
29 |
4.1 |
9 |
| 18. fall from/with bucket (aerial lift/basket) | 12.9 |
2.1 |
19 |
17 |
2.4 |
16 |
| 19. fall from/with structure (other than roof) | 51.0 |
8.2 |
2 |
74 |
10.5 |
2 |
| 20. fall from/with platform or catwalk | 14.4 |
2.3 |
17 |
14 |
2.0 |
19 |
| 21. fall through opening (other than roof) | 16.5 |
2.6 |
15 |
18 |
2.5 |
15 |
| 22. fall, other or unknown | 5.0 |
0.8 |
26 |
1 |
0.1 |
29 |
| 23. fire/explosion/scalding | 13.8 |
2.2 |
18 |
14 |
2.0 |
19 |
| 24. hyperthermia/hypothermia | 4.0 |
0.6 |
28 |
8 |
1.1 |
23 |
| 25. hit, crushed, fall during lifting operations | 33.9 |
5.4 |
5 |
27 |
3.8 |
11 |
| 26. struck by falling object/projectile (including tip-overs) | 24.4 |
3.9 |
12 |
36 |
5.1 |
7 |
| 27. crushed/suffocation from trench collapse | 29.0 |
4.7 |
8 |
41 |
5.8 |
6 |
| 28. crushed while unloading-loading equipment/material (except by crane) | 11.5 |
1.8 |
21 |
23 |
3.3 |
14 |
| 29. shock/burn from lightning | 14.8 |
2.4 |
16 |
14 |
2.0 |
19 |
623.3 |
100.0 |
707 |
100.0 |
|||
While the number of OSHA-inspected fatal construction events have had an upward trend since 1991, employment in construction establishments has also increased7. The trend of these fatal events per 100,000 construction establishment employees is as follows: 1991 – 1992: 13.1; 1993 – 1994: 11.8; 1995: 11.4; 1996: 10.5; 1997: 10.6; 1998: 10.4; 1999: 11.0; 2000: 9.5; 2001: 10.8; 2002: 10.7; and 2003: 10.5.
IV. Analysis by Victim’s Situation
An analysis was performed to classify the fatal events by three general categories: (1) victim(s) was primary, immediate contributor to the event; (2) person(s) other than victim(s) was primary, immediate contributor to the event; and (3) no individual directly contributed to the event, the victim(s) being “at the wrong place at the wrong time”.
The first category includes, for example, most falls, crushing/runover of operators, electrocutions other than those occurring during lifting operations, asphyxiations and hypothermia. The second category includes, for example, most crushing/runover of nonoperators, lifting operations, loading/unloading of equipment/materials, struck by highway vehicles, falls from/with aerial lifts, and electrocutions from crane boom/tackle contacting overhead powerlines. The third category includes, for example, most structure and trench collapses, struck by projectile/falling objects, and lightening.
Although the classifications were often subjective due to a lack of precise information or conflicting information, following are the results for the 707 events: (1) victim primary initiator of event: 433 events (61.2) percent; (2) person other than victim was primary initiator: 153 events (21.6 percent); (3) “wrong place at wrong time”: 110 events (15.6 percent); and (4) unknown: 11 events (1.6 percent).
An additional classification of the 707 fatal events was also performed to estimate the distribution of events by work status of the victim: (1) victim(s) was performing his task (as opposed to going to/from task station); and (2) victim was relocating between task stations, leaving/returning for breaks, lunch, etc., or beginning/ending work day.
The first category includes, for example, many roofing fatalities, fatalities resulting from structure and trench collapses, events involving crushing/runover of operators, electrocutions while installing electrical equipment, workers caught in stationary equipment and workers falling from/with aerial lifts and scaffolds.
The second category includes, for example, some nonoperators crushed/runover by construction equipment, foremen/supervisors, ladder falls, laborers/riggers awaiting completion of lifts and workers climbing/relocating during building steel erection and communication tower erection/alteration.
As with the previously discussed classification of who initiated the event, the work status classifications were also subjective – perhaps even more so. Never-the-less, it may be useful in understanding in a general sense the situations in which construction fatalities occur. It was found that: (1) 511 (72.3 percent) of the fatal events involved workers performing work at their task site; (2) 161 (22.8 percent) of the events involved workers entering, leaving or away from their task site; and (3) 35 (5.0 percent) of the events could not be classified.
V. Analysis of Fatal Events by Day of Week and Time
The fatality data reported on OSHA Form 170 includes the date and time of day of most fatal events. Table 3 shows the distribution of fatal events by day of the week. Contrary to the popular conception that most fatalities occur on Mondays and Fridays, it can be seen that Monday and Wednesday had an almost identical number of events, 148 and 146, respectively, and Friday had the fewest number of fatal events, 96, when weekends are excluded. However, without knowing the total number of construction hours worked each day, it is not possible to conclude that any one day is more or less hazardous than another.
Table 3. Distribution of Fatal Construction Events by Day of Week
| Day | Number of Events |
| Monday | 148 |
| Tuesday | 126 |
| Wednesday | 146 |
| Thursday | 132 |
| Friday | 96 |
| Saturday | 49 |
| Sunday | 10 |
| Total | 707 |
Table 4 shows the distribution of fatal events by hour (military) of the day. It can be seen that the two-hour periods before (10 – 11) and after (13 – 14) the noon period hour contained the most fatal events, 151 and 157, respectively, while the noon hour had the fewest number of events, excluding the hours before 8:00 and after 16:00 hours. As pointed out previously, without knowing the total hours worked in construction each hour, it is not possible to calculate hourly event rates. However, it may be reasonably assumed that the total construction hours worked each hour during the 8-11 hour period and the 13-16 hour period are approximately equal. Even if this were true, the hourly differences would not be statistically significant.
Table 4. Distribution of Fatal Construction Events by Hour
| Hour | Number of Events |
| 0-1 | 9 |
| 1-2 | 3 |
| 2-3 | 3 |
| 3-4 | 2 |
| 4-5 | 1 |
| 5-6 | 2 |
| 6-7 | 5 |
| 7-8 | 36 |
| 8-9 | 62 |
| 9-10 | 69 |
| 10-11 | 75 |
| 11-12 | 76 |
| 12-13 | 40 |
| 13-14 | 81 |
| 14-15 | 76 |
| 15-16 | 62 |
| 16-17 | 50 |
| 17-18 | 21 |
| 18-19 | 13 |
| 19-20 | 6 |
| 20-21 | 3 |
| 21-22 | 6 |
| 22-23 | 2 |
| 23-24 | 4 |
| Total | 707 |
APPENDIX A
Definitions of Fatality Causes
1. asphyxiation/inhalation of toxic vapor: lack of oxygen and/or inhalation of toxic gas, (excluding asphyxiation resulting from fire/explosion).
2. caught in/struck by stationary equipment: body or clothing caught pulling worker into equipment.
3. collapse of structure: building or other structure falling on worker, not including falling ladder, scaffold, aerial lift/ basket, platform, with a structure, trench collapse, or wall (earthen) collapse.
4. crushed/run-over of non-operator by operating construction equipment: non-operator run-over or crushed between equipment and ground or another object by an operator controlled piece of construction equipment.*
5. crushed/run-over/trapped of operator by operating construction equipment: includes rollover and catching of body in equipment or between equipment and ground or other object while operating the equipment.
6. crushed/run-over by construction equipment during maintenance/ modification: includes equipment/parts falling on worker while assembling or disassembling equipment.
7. crushed/run-over by highway vehicle: any run-over by non-construction equipment, including trains.
8. drown, non-lethal fall: non-lethal falls into water and flooding of container, trenches, etc.
9. electrocution by touching exposed wire/source: body part contacting the wire/source except when installing equipment or using a tool.
10. electrocution by equipment contacting wire- a. ladder
b. scaffold
c. crane/lifting equipment/boom/dump truck:
d. other: contact while handling materials, e g. gutters, iron rods, painting equipment, etc.
11. electrocution from equipment installation/tool use: includes failure to de-energize equipment, inappropriate energizing, contacting energized part with tool or body, and inadequately grounded tools or exposed tool wires.
12. electric shock, other and unknown cause
13. elevator (struck/crushed by elevator or counter-weights):
14. fall from/with ladder: includes collapse/fall of ladder.
15. fall from roof; fall through roof: skylight or other opening.
16. fall from vehicle (vehicle/construction equipment): falls from vehicle or equipment while in motion or at rest.
17. fall from/with scaffold: includes collapse/fall of scaffold.
18. fall from/with bucket (aerial lift/basket): includes collapse/fall of bucket.
19. fall from/with structure (other than roof): fall through opening in the side or through the floor (not opening in the floor) and with the structure in a collapse.
- a. fall with collapse of structure
20. fall from/with platform or catwalk (attached to structure: includes collapse/fall of platform.
21. fall through opening (other than roof): falls through stairwells, equipment openings, or other openings in a floor.
22. fall, other or unknown
23. fire/explosion/scalding, excluding electrical burns/explosions
24. heat/hypothermia
25. lifting operations: failure of equipment, inappropriate lifting, and all loading and unloading by crane operations except electrocution. (Includes objects falling and striking victim during lifting operation).
26. struck by falling object/projectile (including tip-overs): does not include collapse of structure, trench, earthen wall, or lifting operations.
27. trench collapse: includes earthen wall
28.unloading-loading equipment/material (except by crane): includes slipping and tipping over of construction equipment/material while loading and unloading.29. lightning
30. crushed
31. unknown cause or other
APPENDIX BFigure B1. Comparison of Construction Fatality Causes (Pooled Years 1995-2002 with 2003)
Figure B2. Frequency of Causes of Construction Fatality Events (2003)
Figure B3. Frequency of Causes of Construction Fatality Events (1995–2002)
Figure B4. Comparison of Construction Fatality Causes - Combined Categories (Pooled Years 1995-2002 with 2003)
APPENDIX C
Table C1. Construction Fatal Events by End-Use Type, 2003
End Use |
|
Number of |
|
Cumulative |
Type |
Description |
Frequency |
Percent |
Percent |
|
|
|
|
|
1 |
Bridge |
25 |
3.54 |
3.54 |
2 |
Commercial Building |
145 |
20.54 |
24.08 |
3 |
Contractor’s Yard/Facility |
9 |
1.27 |
25.35 |
4 |
Excavation, Landfill |
4 |
0.57 |
25.92 |
5 |
Highway, Road, Street |
87 |
12.32 |
38.24 |
6 |
Manufacturing Plant |
22 |
3.12 |
41.36 |
7 |
Multi-Family Dwelling |
54 |
7.65 |
49.01 |
8 |
Other Building |
84 |
11.9 |
60.91 |
9 |
Other Heavy Construction |
18 |
2.55 |
63.46 |
10 |
Pipeline |
21 |
2.97 |
66.43 |
11 |
Powerline, Transmission Line |
27 |
3.82 |
70.25 |
12 |
Powerplant |
8 |
1.13 |
71.38 |
13 |
Refinery |
3 |
0.42 |
71.80 |
14 |
Sewer/Water Treatment Plant |
22 |
3.12 |
74.92 |
15 |
Shoreline Development, Dam, Reservoir |
4 |
0.57 |
75.49 |
16 |
Single Family or Duplex Dwelling |
154 |
21.8 |
97.02 |
17 |
Tower, Tank, Storage Elevator |
19 |
2.68 |
100.00 |
|
|
706 |
100.0 0 |
|
The coding for these data could not be verified.
OSHA records included one event for which there was no end-use type identification; therefore, the total in this table differ from the total in Table 1.
Table C2. Construction Fatal Events by Type of Project, 2002
Project |
|
Number of |
|
Cumulative |
Type |
Description |
Frequency |
Percent |
Frequency |
|
|
|
|
|
1 |
New, Addition and Alteration Construction |
504 |
71.49 |
7.49 |
2 |
Maintenance, Repair and Demolition |
155 |
21.99 |
93.48 |
3 |
Other |
46 |
6.52 |
100.00 |
|
|
705 |
100.00 |
|
The coding for these data could not be verified.
OSHA records included two events for which there was no type of project identification; therefore, the total in this table differ from the total in Table 1.
Table C3. Construction Fatal Events by Four-Digit SIC, 2002
Description |
SIC |
Number of Frequency |
Percent |
Cumulative Percent |
General Contractors - Single Family Houses |
1521 |
30 |
4.24 |
4.24 |
General Contractors - Residential Buildings Other than Single Family |
1522 |
15 |
2.1 2 |
6.36 |
General Contractors - Industrial Building and Warehouses |
1541 |
14 |
1.98 |
8.34 |
General Contractors - Non-residential Buildings, other than Industrial and Warehouse |
1542 |
33 |
4.67 |
13.01 |
Highway and Street Construction, Except Elevated Highways |
1611 |
63 |
8.91 |
21.92 |
Bridge, Tunnel, and Elevated Highway Construction |
1622 |
13 |
1.84 |
23.76 |
Water, Sewer, Pipeline, and Communications and Power Line Construction |
1623 |
62 |
8.77 |
32.53 |
Heavy Construction, Not Elsewhere Classified |
1629 |
27 |
3.82 |
36.35 |
Plumbing, Heating and Air-Conditioning |
1711 |
27 |
3.82 |
40.17 |
Painting and Paper Hanging |
1721 |
35 |
4.95 |
45.12 |
Electrical Work |
1731 |
59 |
8.35 |
53.47 |
Masonry, Stone Setting, and Other Stone Work |
1741 |
23 |
3.25 |
56.72 |
Plastering, Drywall, Acoustical, and Insulation Work |
1742 |
16 |
2.26 |
58.98 |
|
1743 |
1 |
0.14 |
59.12 |
Carpentry Work |
1751 |
42 |
5.94 |
65.06 |
Floor Laying and Other Floor Work, Not Elsewhere Classified |
1752 |
1 |
0.14 |
65.20 |
Roofing, Siding, and Sheet Metal Work |
1761 |
67 |
9.48 |
74.68 |
Concrete Work |
1771 |
19 |
2.69 |
77.37 |
Water Well Drilling |
1781 |
8 |
1.13 |
78.50 |
Structural Steel Erection |
1791 |
36 |
5.09 |
83.59 |
Glass and Glazing Work |
1793 |
2 |
0.28 |
83.87 |
Excavation Work |
1794 |
37 |
5.23 |
89.10 |
Wrecking and Demolition Work |
1795 |
16 |
2.26 |
91.36 |
Installation or Erection of Building Equipment, Not Elsewhere Classified |
1796 |
7 |
0.99 |
92.35 |
Special Trade Contractors, Not Elsewhere Classified |
1799 |
54 |
7.64 |
99.99 |
707 |
99.9 |
The coding for these data could not be verified.
Table C4. Construction Fatal Events by Project Value, 2002
| Project Value Code | Description | Number of Frequency |
Pecent |
Cumulative Percent |
| 1 | Under $50,000 | 228 |
32.29 |
32.29 |
| 2 | $50,000-$250,000 | 137 |
19.41 |
51.70 |
| 3 | $250,000-$500,000 | 65 |
9.21 |
60.91 |
| 4 | $500,000-$1,000,000 | 74 |
10.48 |
71.39 |
| 5 | $1,000,000-$5,000,000 | 98 |
13.88 |
85.27 |
| 6 | $5,000,000-$20,000,000 | 61 |
8.64 |
93.91 |
| 7 | $20,000,000 and over | 43 |
6.09 |
100.00 |
706 |
100.0 |
The coding for these data could not be verified.
OSHA records included one event for which there was no project value identification; therefore, the total in this table differ from the total in Table 1.
Table C5. Construction Fatalities by Construction Operation, 2003
Code |
Description |
Frequency |
Percent of Events |
01 |
Backfilling and compacting |
6 |
0.82 |
02 |
Bituminous concrete placement |
5 |
0.68 |
03 |
Construction of playing fields, tennis courts |
1 |
0.14 |
04 |
Cutting concrete pavement |
8 |
1.10 |
05 |
Demolition |
31 |
4.24 |
07 |
Elevator, escalator installation |
2 |
0.27 |
08 |
Dredging |
3 |
0.41 |
09 |
Erecting structural steel |
16 |
2.19 |
11 |
Excavation |
29 |
3.97 |
12 |
Exterior masonry |
21 |
2.88 |
13 |
Exterior cladding |
7 |
0.96 |
14 |
Exterior carpentry |
36 |
4.93 |
15 |
Exterior painting |
27 |
3.70 |
16 |
Fencing, installing lights, signs, etc. |
12 |
1.64 |
17 |
Fireproofing |
2 |
0.27 |
18 |
Forming |
7 |
0.96 |
19 |
Forming for piers or pylons |
2 |
0.27 |
20 |
Installing interior walls, ceilings, doors |
15 |
2.05 |
21 |
Installing metal siding |
8 |
1.10 |
22 |
Installing windows and doors, glazing |
5 |
0.68 |
23 |
Installing culverts and incidental drainage |
12 |
1.64 |
24 |
Installing equipment (HVAC and other) |
37 |
5.07 |
25 |
Installing plumbing, lighting fixtures |
24 |
3.29 |
26 |
Installing underground plumbing conduit |
12 |
1.64 |
27 |
Interior tile work (ceramic, vinyl, acoustic) |
1 |
0.14 |
28 |
Interior masonry |
3 |
0.41 |
29 |
Interior plumbing, ducting, electrical work |
8 |
1.10 |
30 |
Interior carpentry |
16 |
2.19 |
31 |
Interior painting and decorating |
12 |
1.64 |
32 |
Landscaping |
5 |
0.68 |
34 |
Paving |
19 |
2.60 |
35 |
Pile driving |
7 |
0.96 |
36 |
Placing bridge deck |
3 |
0.41 |
37 |
Placing bridge girders and beams |
4 |
0.55 |
38 |
Plastering |
5 |
0.68 |
39 |
Pouring or installing floor decks |
2 |
0.27 |
40 |
Pouring concrete floor at grade |
2 |
0.27 |
41 |
Pouring concrete for piers, and pylons |
2 |
0.27 |
42 |
Pouring concrete foundations and walls |
4 |
0.55 |
43 |
Roofing |
65 |
8.90 |
45 |
Site clearing and grubbing |
27 |
3.70 |
46 |
Ships |
6 |
0.82 |
47 |
Stripping and curing concrete |
2 |
0.27 |
50 |
Temporary work (buildings, facilities) | 27 |
3.70 |
51 |
Traffic protection | 18 |
2.47 |
52 |
Trenching, installing pipe | 37 |
5.07 |
53 |
Waterproofing | 7 |
0.96 |
54 |
Steel Erection of Solid Web-Connecting | 3 |
0.41 |
55 |
Steel Erection Of Solid Web-Bolting-Up/Detail Work | 3 |
0.41 |
56 |
Steel Erection Of Solid Web-Welding/Burning/Grinding | 2 |
0.27 |
58 |
Steel Erection of Solid Web-Moving Point To Point | 2 |
0.27 |
59 |
Steel Erection Of Solid Web-Landing Materials (Hoisting) | 2 |
0.27 |
60 |
Steel Erection Of Open Web Steel Joists-Connecting | 2 |
0.27 |
61 |
Steel Erection Of Open Web Steel Joists-Bolting-Up/Detail Work | 1 |
0.14 |
62 |
Steel Erection Of Open Web Steel Joists-Welding/Burning/Grinding | 1 |
0.14 |
66 |
Installation Of Decking-Initial Laying Deck (Including Layout & Safety) | 8 |
1.10 |
67 |
Installation Of Decking-Final Attachment Deck (Welding/Shear Studs/Etc | 2 |
0.27 |
69 |
Installation Of Decking-Hoisting Bundles | 1 |
0.14 |
70 |
Other Activities-Installing Ornamental And Architectural Steel | 8 |
1.10 |
71 |
Other Activities-Post Decking Detail Work | 8 |
1.10 |
00 |
Unknown | 77 |
10.55 |
730 |
100.00 |
The coding for these data could not be verified.
1. An Analysis of Fatal Events in the Construction Industry, 1991-1992 (1993), An Analysis of Fatal Events in the Construction Industry, 1993-1994 (1995), An Analysis of Fatal Events in the Construction Industry, 1995 (1996), An Analysis of Fatal Events in the Construction Industry, 1996 (1997), An Analysis of Fatal Events in the Construction Industry, 1997 (1999), An Analysis of Fatal Events in the Construction Industry, 1998 (2000), An Analysis of Fatal Events in the Construction Industry, 1999 (2001), An Analysis of Fatal Events in the Construction Industry, 2000 (2002), An Analysis of Fatal Events in the Construction Industry, 2001 (2003) and An Analysis of Fatal Events in the Construction Industry, 2002 (2004) Construction Industry Research and Policy Center , University of Tennessee, Knoxville.
2. States in the Federal System are: AL, AR, CO, CT, DE, DC, FL, GA, ID, IL, KS, LA, ME, MA, MS, MO, MT, NE, NH, NJ, NY, ND, OH, OK, PA, RI, SD, TX, WV and WI. States and Territories under State Plans are: AK, AZ, CA, HI, IN, IA, KY, MD, MI, MN, NV, NM, NC, OR, PR, SC, TN, UT, VT, VI, VA, WA and WY.
3. Each event included at least one person killed and in several events additional workers were killed or injured.
4. Drudi, Dino and Mark Zak,” Work–Related Multi-Fatality Incidents,” Monthly Labor Review, Vol. 127, No. 10, October 2004.
5. Sidney Siegel, Nonparametric Statistics for the Behavioral Sciences (New York: McGraw-Hill Book Co., Inc., 1956), p. 219.
6. Five of the 719 fatal events in 2002 and 17 of 719 fatal events in 2001 had either no narrative or a narrative too incomplete to classify the cause of fatality. These records were coded as “unknown” cause; this was not done in prior years. They were omitted from the calculation of the Spearman Rank correlation in order to avoid data distortion.
7. Bureau of Labor Statistics, National Employment, Hours, and Earnings.
* Includes fatalities resulting from asphyxiation/fire/explosion/drowning of trapped operators.