How We Can Better Learn from Electrical Accidents
Summary Statement
Discusses the benefits of having a large database of information about electrical safety accidents and near-misses to help
make decisions on equipment and system design,
work practices, training, and improvement programs.
May/June 2000
Abstract:
This paper addresses the benefit of having a heavily populated electrical safety incident database from which to make decisions on equipment and system design, work practices, training, and improvement programs. Limitations of national and industry electrical accident databases are reviewed. The paper emphasizes the importance of thorough investigation of near miss incidents to validate recommendations from incidents with injuries and includes an analysis of 500 electrical safety incident investigations in one large chemical company. Findings derived from the analysis have business, manufacturing, engineering, behavioral and regulatory impact.INTRODUCTION
The quality of our decisions is primarily dependent on available reference
data and analytical skills and judgment based on individual experience.
If the decision maker is engineering, designing, manufacturing, installing,
operating or maintaining systems having electrical hazards, the decision
may impact safety. Commonly held beliefs and attitudes based on inaccurate
or incomplete data regarding electrical hazards and injuries contribute
to the cause of electrical accidents and injuries. The way information
and statistics are collected, analyzed and applied could be improved
and result in more realistic beliefs and attitudes. The acceptance of
what may be unsafe decisions may be derived from misperceptions due
to lack of valid information. [1]
The quality of accident data and the learning derived from injury and
accident databases impacts everyone exposed or concerned with potential
electrical injury: This includes those involved in writing codes, standards,
and regulations; those involved in training and education; those responsible
for establishing safety related goals and objectives for an organization;
manufacturers of electrical products and equipment; and the designers,
engineers, electricians, and others applying their skills everyday in
the workplace.
For the electrician or plant operator, this impacts their understanding
of electrical hazards, their frequency and degree of risk, and injury
consequences long term. Those involved in development of codes and standards
work from their individual experience context rather than from a commonly
shared experience base of what when where and who regarding accidents
and injuries. The writing of codes and standards often involves a process
of finding the lowest common denominator that all can agree too. A higher
quality shared database could result in faster and more effective evolution
in codes and standards. The ultimate and tragic result is more accidents
and injuries and business losses.
ACCIDENT DATABASES
Databases maintained by government agencies and various safety organizations
provide useful, but limited information. The data is generally limited
to fatalities and serious disabling injuries. Accident scenarios are
generally not available. The details that help an individual relate
the statistic to the real world situations are not there. Here are some
examples.
From 1993 to 1995 there has been a steady increase in the percentage
of fatal occupational injuries as a result of contact with electrical
current. In 1995 there were 347. Of those injuries, 163 were in the
construction industry. [3]
From 1980 through 1989 the leading cause of occupational injury death
were motor vehicle crashes (23%), machine related incidents (14%), homicides
(12%), falls (10%),electrocutions (7%) and being struck by falling objects
(7%). Electrocution was the leading cause of death in the Tech/Support
and Crafts occupational groups. [4]
Although this information is important it is incomplete. It is also
hard to relate this information to a personal level. Many of the injuries
that are actually related to electrical injury end up being listed under
different types of injuries. Arc flash injuries are usually listed as
burn injuries and are not shown as electrical injuries. This distorts
the data on electrical injuries.
Near Miss Accident
Data
In the 1930’s, Heinrich introduced a relationship that is widely
accepted today which established a numerical relationship with accidents
of increasing severity of consequences. [2] As shown in Fig. 1. Heinrich’s
theory holds that although each of the near misses could have resulted
in a serious injury, most do not. However, once an incident is in progress,
its ultimate outcome is largely a matter of luck. The fact that most
do not result in negative consequences contributes to acceptance of
unsafe decisions. Most organizations and companies do not have sufficient
serious injuries on which statistically valid conclusions could be drawn.
If near miss incidents were identified and analyzed, there would be
sufficient data on which to develop trends and analysis , and identify
underlying systemic causes.
| Figure 1 An Illustration of Heinrich’s Theory |
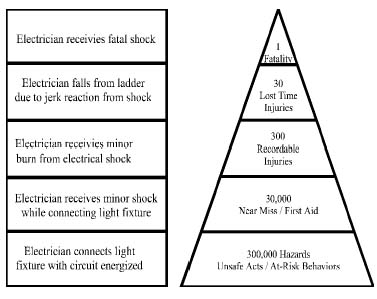 |
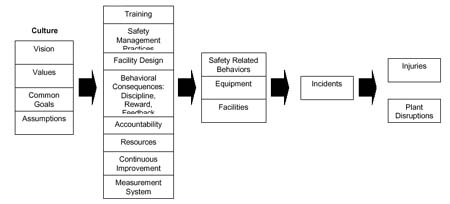
Fig 2 depicts a relationship between underlying causes, incidents, and accident consequences. In this model, the undesirable consequences on the right are products of incidents which result from people’s interaction with equipment and facilities. The underlying cause of deficiencies in peoples’ behavior and condition of equipment and facilities are rooted in systems such as those used to manage safety, the design, operation and maintenance of facilities, and training and development of people. The quality of these systems is a product of the organization culture. If a deficiency in the culture of managing systems in an organization can be corrected, the result could prevent many near miss incidents. The ability to focus effective improvement in the organizational culture and managing systems impacting electrical safety is dependent on the quality of incident and accident analysis. The ability of an organization to improve its electrical safety program may be dependent on improving capability to identify and capture data on near miss incidents.
| Figure 2 The Relationship of Systemic Causes of Electrical Incidents and Potential Undesirable Consequence |
 |
Accident Case
Histories
Fig. 3 is an example of an accident case history that tells a story
that is useful in bridging between statistics and real everyday situations.
A person may not be able to identify with numbers in a database, but
may be able to see his or herself in this situation.
Case histories like this are effective awareness raising and learning
aides. They serve to create value for rules, practices, codes, standards,
and regulations. Unfortunately, case history documentation is often
difficult to find, share, or publish.
| An Unguarded
Banana Plug Two electricians were severely burned, one fatally, while testing for voltage in a motor starter. As one held the multimeter, the second applied the test prods to energized terminals. One electrician's unexpected movement caused a test lead banana plug to separate from the multimeter jack. The banana plug, energized from the test circuit, contacted the grounded metal enclosure of the motor control center and initiated a high energy electric arc. |
| Figure 3 An Example of Case History that has Awareness or Teaching Value |
Database Example
Overview
At the beginning of the effort to improve electrical safety the driver
was the rising trend in the number of injuries occurring. These injuries
were lost work-day injuries and fatalities. These were the only types
of electrical incidents reported. Incidents occurring without serious
injury were not reported nor was it generally believed necessary. Over
the years attitudes have changed. Having to report certain types of
injuries to OSHA moved the monitoring process upstream from lagging
indicators towards leading indicators. Although an injury has occurred
it should be considered a move in the right direction. Tracking incidents
is another move upstream. In most cases tracking only serious injuries
does not provide enough data to identify trends. By tracking incidents
the number of entries is greatly increase and trends can be identified
hopefully prior to an injury occurring.
Currently there are approximately 500 incidents in the database. The
information was pulled from incident reports that had been shared across
our Electrical Safety network. At first there was some reluctance to
share incident reports. This stemmed from a fear of being judged by
the number of incidents perceived coming from one facility. Much of
this resistance was eliminated by stressing the importance of what could
be learned from the incidents. The information from the database that
was circulated was sanitized to remove the facility where the incident
took place and when it occurred. Once we had enough information in the
database to generate reports it became an easy sell to encourage the
sites to share their incidents. The information derived from the database
provided statistics supporting many of the concerns facing the electrical
safety teams at the sites.
Another obstacle to overcome was determining what should be considered
an electrical incident. The following definition for an electrical incident
was developed and agreed upon to overcome this obstacle.
| Definition
of an Electrical Incident: An electrical incident is an event resulting from either personnel action or equipment failure involving electrical installations that has the potential to result in an injury due to: 1) electrical flash and/or burn, 2) electric shock from a source greater than 50Vac or 100Vdc, or 3) reflex action to an electric shock |
This definition
provided a way for people to determine if the event was an electrical
incident. As people internalized this definition their understanding
and awareness of electrical safety increased. They began to recognize
that more incidents were occurring than they first believed.
The database is structured to pull information from the incident reports.
This also helps to provide a framework for what the incident report
should include. Over the last 2 years the structure of the database
has changed as a result of feedback from the people using the information.
The structure of the database is as follows.
Date The
date the incident occurred is in the database. This was done to determine
if more incidents occurred during any particular time of the year. This
field is not included when the information from the database is distributed.
Site The site is in the database but is not included in distributed
information. If a site wants a list of the incidents that has occurred
at their site the information can be extracted from the database.
Description The incident, or what happened, is briefly described,
usually in one sentence.
Cause A
brief description of the cause for the incident is provided. This may
not be the root cause. Until a uniform method of determining the root
cause and training in that methodology is done, this field can not accurately
provide a root cause.
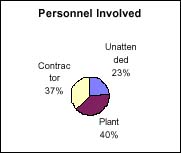
Roll This field indicates whether the persons involved in the incident
are either company employees “P” or contractor employees “C”.
Incidents where no one was present at the time are listed as unattended
“U”. This usually indicates equipment failure.
Function If someone is involved with an incident their function
is listed. An electrical person is
listed as “E”. If they are not an electrical person, then
they are listed by their function, such as operator “O”, or
pipefitter “P”.
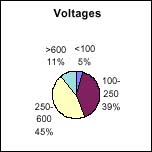
Voltage The
voltage involves with the incident is listed. Currently the voltages
are broken down into four groups; less than 100 volts, 100 volts to
250 volts, 250 volts to 600 volts, & greater than 600 volts.
Energy Level This is used to determine if the person was inside
the flash hazard boundary.
Injury This field indicates whether a injury occurred, either a
“Y” or “N”. If someone received an electrical shock
it is indicated in this field with “S”.
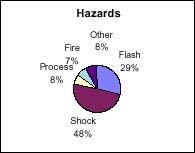
Hazard This lists the hazard presented by the incident. Four choices
are tracked; exposure to a flash hazard, exposure to a shock hazard,
a hazard to the operating process (shutdown), or other. Other usually
has been a fire hazard.
Equipment Involved
The type of equipment involved is tracked. Some examples are; Motor
Control Centers, Overhead lines, portable equipment (electric hand tools).
Several reports are routinely generated from the database. The list
of reports is not a fixed set. Over time reports have been added and
some requests for special reports have been filled. Below is a sampling
of some of the reports generated.
Summary Report
This is a summary of the information contained in the database. This
can be produced for the entire database or by year. The report summarizes;
Roll of the personnel involved
Function of the personnel involved
Number of injuries
Number by voltage category
Number of electrical shocks with and without injury
Number by hazard exposure
Number by equipment involved
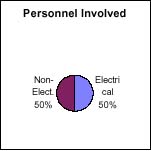
Personnel Involved There are two reports in this category. The first
gives a breakdown by percentage between the company employees, contractor
employees, and unattended incidents. The second gives a breakdown by
percentage between electrical and non-electrical personnel involved
in incidents. The database can also provide a comparison between the
total number on incidents and the current year.
Voltages
This graph depicts the breakdown of the voltage categories.
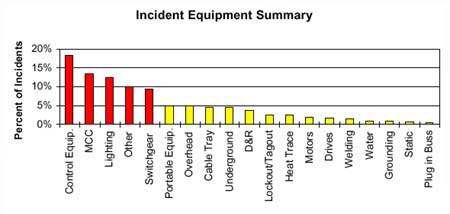
Incident Equipment Summary This provides a “Paretto”
type breakdown of the equipment involved in the incidents.
Learnings
As a result of the reports and charts produced from the database learnings
have been continuous. Each new year provides a different set of learnings.
The greatest learning from the database was how it was received. As
information was extracted from the database and distributed it encouraged
people at the sites to share more information. The information is shared
at all levels at the sites creating a higher level of electrical safety
awareness.
Another learning
from the database is the alarming number unattended incidents occurring.
There is an effort under way to understand the reason for this trend.
Previous years have indicated the majority of the incidents involved
electrical personnel. This came as no surprise. But the information
for 1996 indicates that non-electrical personnel were the majority.
The overall total for a 7 year period also indicated that the number
of incidents involving non-electrical personnel was equal to that of
electrical personnel. Unfortunately the database does not tell us why.
But one reason could be non-electrical personnel need more training
and awareness concerning electrical hazards.
In 1996 an alarming
trend was recognized. During a six week period the number of reported
electrical shocks, without injury, rose dramatically. As a result an
“alert message” was sent out to all personnel. The trend was
turned around.
Although not all incidents have an impact on the production at a facility
when there is an impact it can significant. Based on the information
on “hazard to the operating process” an effort has begun to
measure the impact of electrical incidents on the uptime of facilities
and the impact on business.
Future State
As we move forward we need to have a vision of what the future might
be like if a database existed that contains the information required
to make fact based decisions. As stated earlier we currently make decisions
based upon our experiences. We need information that is beyond our own
personal experiences. Incidents and injuries that occur outside our
normal area of interaction can provide information that can impact how
we think about electrical safety and how we interact with electricity.
We need a database of electrical incidents with and without injury.
There is some information available in various locations but this needs
to pulled together. Having only injuries in the database limits the
database. “Near-miss” incidents need to included. We should
not wait until we have an injury to learn something.
The people who need this information the most are the people who interact
with electricity. This is not just electricians. All of us interact
with electricity on a daily basis. People who work in our facilities
are exposed to the hazards of electricity repeatedly. These people need
to understand what the potential hazards of electricity are, what hazards
they are exposed to and how they place themselves at risk. Having examples
of what has occurred allows people to gain a better understanding what
can happen and that it does happen. We interact with electricity so
much we forget the hazards it presents and this when we get in trouble.
What hidden hazards are there that people need to know about?
There is another
group who needs to understand the possibilities. These are the people
who impact how others are placed at risk. Managers and supervisors determine
whether people will be placed in harms way or not by how work is assigned
and carried out. What actions, training or procedure needs are there
so the work can be done with a minimal exposure to personnel? Engineers
who design electrical equipment determine how people will exposed. What
changes in equipment design need to be made so that it minimizes the
hazard exposure to the people who interact with the equipment? Engineers
and designers who design our facilities impact how people will need
to interact with electrical equipment. What things need to be included
in the design to assure safe interaction with the electrical equipment?
Over the recent years electrical safe work practices have been revised
partly based upon the experiences of people and from information obtained
from incidents and injuries from several sources. Major step changes
have occurred from this effort. Change will continue in the future but
the next major step change may have to come from fact based decisions.
Changes in equipment design will continue as new technology is introduced
and applied to the equipment. But how will safety improvements be added
to equipment? Because of the recent changes in electrical safe work
practices electrical safety training has increased. But the training
is based upon the changes in practices and is not based upon the needs
that may exist in the people interacting with electricity.
Other organizations have extensive information concerning injury and accidents to draw upon and continuous improvement has been made and is still being made based upon the information obtained from extensive databases. By having information on what is occurring we can begin to answer these questions. Training can become focused in areas where the greatest need exists. By concentrating on a fact based need the training can be more effective. By having information available training will be more receptive. Understanding the nature of incidents and injuries on a broad scale equipment and facility designs can analyzed to reduce the exposure to people who interact with electricity. Safe work practices can be revised to prevent reoccurrence. Understanding the nature of incidents will provide new insight to the cause of incidents and injuries. This will change how we think about electrical safety.
Conclusion
With a vision of having a database of incidents and injuries we can move to the future. But there are things that need to be done at all levels. As individuals we must find how to be involved. As a company we need to be willing to share the information we have. As the PCIC we need to support efforts that are moving in this direction and if none exists help establish a direction. Only through active involvement will real understanding of electrical safety be achieved. But more than anything, once we have the information we need to act on it.
REFERENCES
[1] M. Capelli-Schellpfeffer, M. Toner, R.C. Lee, K.R. Diller, “Correlation
Between Electrical Accident Parameters and Sustained Injury” IEEE
PCIC Conference, September 1996.
[2] Heinrich reference
[3] National Safety Council Accident Facts, 1995 Edition, 1996 Edition,
1997 Edition
[4] Fatal Injuries to Workers in the United States1980-1989: A Decade
of Surveillance National and State Profiles, U.S. Department of Health
and Human Services August 1993.
(This paper was presented in its original form at the 1998 IEEE Industry
Applications Society Petroleum and Chemical Industry Technical Conference;
September 30, 1998 in Indianapolis, Indiana.)
| Hazard | Injury | 26 |
| Flash | 172 | |
| Shock | 285 | |
| Operations | 45 | |
| Fire | 41 | |
| Other | 45 | |
| Equipment Involved | MCC | 80 |
| Control Equip. | 104 | |
| Switchgear | 64 | |
| Heat Trace | 13 | |
| Underground | 27 | |
| Overhead Lines | 28 | |
| Portable Equip. | 34 | |
| Lighting | 75 | |
| Welding | 10 | |
| Cable Tray | 28 | |
| Drives | 13 | |
| Motors | 11 | |
| Plug in Buss Duct | 3 | |
| Static | 7 | |
| Groundling | 5 | |
| Other | D & R | 24 |
| Lockout/Tagout | 14 | |
| Water | 7 | |
| Other | 63 | |
| # of Shared Incidents | 597 |
| Roll | |
| 122 | U=Unattended |
| 203 | P=Plant Employee |
| 200 | C=Contractor |
| 26 | Injuries from Elect. Haz. |
| 3 | Non Elect Haz Injuries |
| 3 | First Aid Cases |
| Function | |
| 163 | E=Electrician |
| 62 | O=Operator |
| 27 | P=Pipe |
| 34 | AC=Arch. & Civil |
| 2 | OS=Office Support Pers. |
| 10 | M=Maintenance |
| 1 | TG=Thermographic |
| 24 | EO=Equipment operator |
| 2 | I=Instrument |
| 1 | D=Design |
| 17 | < 120 Volt |
| 167 | 120 Volt to 240 Volt |
| 199 | 480
Volt to 575 Volt |
| 45 | > 600 Vol |
| 71 | # of Elect. Shocks w/o injury |
| 10 | # of Elect. Shocks with Injury |
| 81 | Total # of Elect.Shocks |
| 12 | # of Arc Flash Injuries |