
Summary Statement
A broad collection of tables and charts covering health and safety in the U.S. construction industry, as well as considerable economic and training data.
2007
Section 34: Deaths and Nonfatal Injuries and Illnesses in Construction: Demographic and Geographic Trends
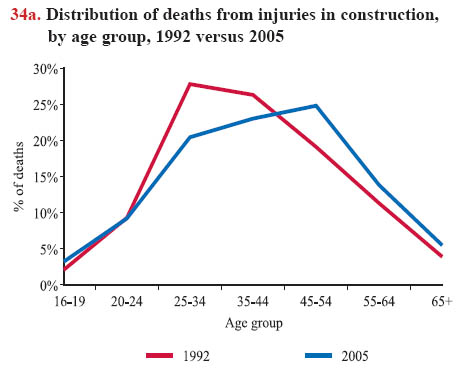
Demographic trends in construction employment are directly reflected in injury and illness trends. The age distribution of work-related injuries suggests that the construction workforce is aging (see chart book pages 12 and 13). From 1992 to 2005, the largest proportion of work-related deaths shifted from the group of workers between 25 and 34 years old to the group aged 45 to 54 (chart 34a). In 2005, 44% of deaths occurred among construction workers age 45 and older, compared with 34% in 1992. This trend mirrors the increase in the number of older construction workers.
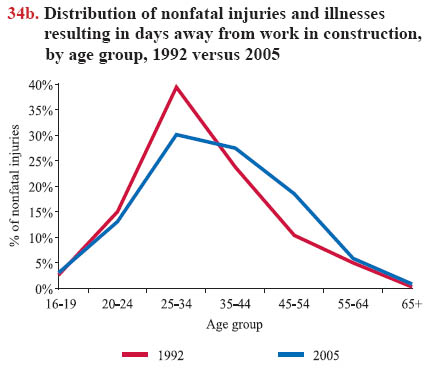
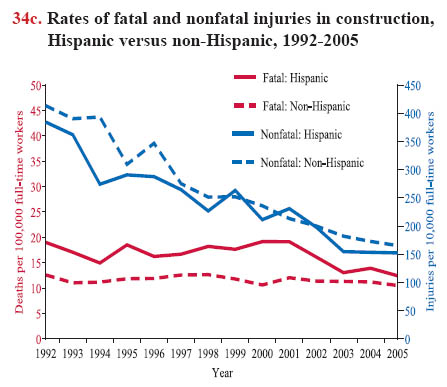
Nonfatal injuries and illnesses followed a similar trend. The proportion of nonfatal cases resulting in days away from work in workers aged 25 to 34 dropped from 39.4% in 1992 to 30.1% in 2005, while nonfatal cases increased among workers aged 45 to 54, from 10.4% to 18.5% during this same period (chart 34b). However, younger construction workers had higher nonfatal injury rates than older workers.1 Illnesses are approximately 2.5% of the total in construction, so the numbers for construction essentially reflect injuries..The number of work-related deaths among Hispanic workers increased dramatically, reflecting the growth of the Hispanic workforce in construction (see chart book pages 14, 15, and 16). Work-related deaths in this group tripled from 108 in 1992 to 321 in 2005. Hispanic construction workers have consistently experienced higher work-related death rates than other workers (chart 34c, see red text). The death rate for Hispanics was nearly twice that of non-Hispanic workers in 2000 (19.15 versus 10.6 per 100,000 full-time workers). Although death rates in construction have declined slightly in recent years, there is still a gap between Hispanic workers and non-Hispanic workers: in 2005, the death rate was 12.4 per 100,000 full-time Hispanic workers compared with 10.5 per 100,000 full-time non-Hispanic workers. This trend is partly attributed to differences in occupational distribution (see chart book page 16): Hispanic workers are more likely than non-Hispanics to work in low-skilled, high-risk construction occupations, such as roofers and laborers.
In contrast to fatal injury rates, the nonfatal injury and illness rates for Hispanic workers were similar to, or in some cases even lower than, rates for other workers (chart 34c, see blue text). In 2005, the work-related injury and illness rate for Hispanic construction workers was about 8% lower – at 152.3 per 10,000 full-time workers – than the rate of 165.3 for non- Hispanics. This result contradicted findings from other sources that indicate Hispanic workers have a higher nonfatal work-related injury rate than workers in other ethnic groups.2 The conflicting data suggest that injuries among Hispanic workers could be underreported to an even greater degree than injuries for non- Hispanic workers (see chart book page 32).
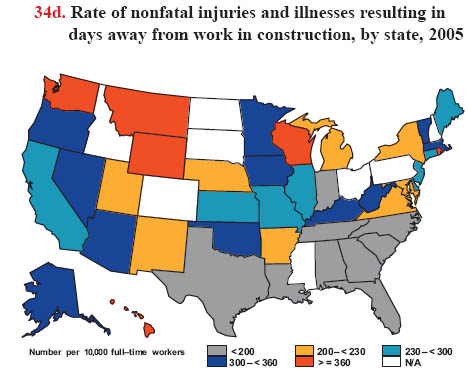
The rates of work-related injuries vary geographically. In 2005, the following six states reported the highest nonfatal injury and illness rates: Montana (514.4 nonfatal injuries and illnesses per 10,000 full-time workers), Wyoming (444.0), Hawaii (422.4), Washington (383.5), Rhode Island (370.9), and Wisconsin (367.3; chart 34d). These states all had higher rates than the entire construction industry on average (239.5). No data are available for eight states.
The numbers of deaths were obtained from the Census of Fatal Occupational Injuries (CFOI) conducted by the U.S. Bureau of Labor Statistics (see chart book page 32). The numbers of construction workers were from the Current Population Survey (see chart book page 9). The nonfatal injury and illness data are from the BLS Survey of Occupational Injuries and Illnesses (SOII; see chart book page 32). Both the CFOI and SOII may underestimate occupational injuries in construction, particularly in informal sectors or "underground" construction. In some cases, construction employees are misclassified into other industry sectors (see chart book page 20). For instance, temporary workers and day laborers may be misclassified under service industries in either the 2002 North American Industry Classification System (NAICS) or the 1987 Standard Industrial Classification (SIC) system. However, when the fatal and nonfatal data collection systems are compared, the numbers and rates for fatal injuries are more complete and accurate than those for nonfatal injuries and illnesses.
Download MS PowerPoint versions of Charts
1. Xiuwen Dong, Yurong Men, and Elizabeth Haile. 2005. Work-related fatal and nonfatal injuries among U.S. construction workers, 1992-2003. The Center to Protect Workers' Rights (CPWR), http://www.cdc.gov/elcosh/docs/d0400/d000433/d000433.html (Accessed November 2007).
2. Glenn Pransky, Daniel Moshenberg, Katy Benjamin, Silvia Portillo, Jeffrey Lee Thackrey, and Carolyn Hill-Fotouhi. 2002. Occupational risks and injuries in non-agricultural immigrant Latino workers. American Journal of Industrial Medicine, 42(2):117-123.
Note:
Chart 34c - Rates are adjusted for full-time workers.
Source:
Chart 34a - U.S. Census Bureau, 1992 and 2005 Current Population Survey, and 1992 and 2005 Census of Fatal Occupational Injuries. Calculations by CPWR Data Center.
Chart 34b - U.S. Bureau of Labor Statistics, 1992 and 2005 Survey of Occupational Injuries and Illnesses, http://www.bls.gov/iif/oshcdnew.htm (Accessed November 2007).
Chart 34c - U.S. Bureau of Labor Statistics, 1992-2005 Census of Fatal Occupational Injuries and 1992-2005 Survey of Occupational Injuries and Illnesses. Calculations by CPWR Data Center.
Chart 34d - U.S. Bureau of Labor Statistics, 2005 Survey of Occupational Injuries and Illnesses, http://www.bls.gov/iif/home.htm (Accessed November 2007).
Back to Table of Contents