
Summary Statement
A broad collection of tables and charts covering health and safety in the U.S. construction industry, as well as considerable economic and training data.
2007
Section 48: Costs of Work-Related Injuries and Illnesses in Construction
Work-related injuries and illnesses mean losses not only to workers, but also to their families, employers, and society. Calculating an accurate estimate of these costs is difficult for many reasons. Some costs, such as wage replacement and medical payments, can be measured directly, but others, such as a family's pain and suffering, are almost impossible to quantify. Many costs are not compensated, partly because they are difficult to link to specific work exposures. Construction workers may move among several employers in a year or even dozens of employers in a career. Work-related musculoskeletal disorders, which can be extremely costly in expense and suffering, often develop through repetition over months or years. Similarly, work-related illnesses, such as cancers or nervous system diseases, may not appear for many years after exposures to asbestos, solvents, or other toxins in the workplace. Therefore, the estimates reported here are only a rough measure and may differ from estimates in other publications due to different measurements.
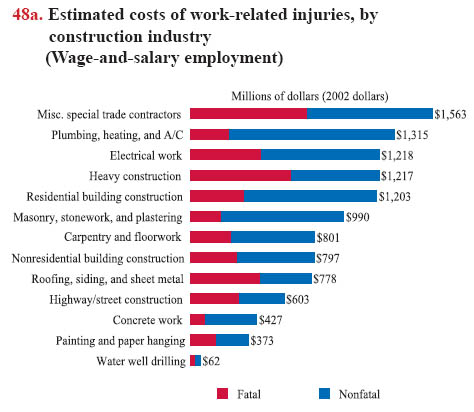
The total cost of fatal and nonfatal injuries in the construction industry is estimated at nearly $13 billion1 annually. Deaths are estimated to be 40% of the total, and nonfatal injuries and illnesses, mainly injuries with days away from work,2 represent 60% of the total cost. On average, the death of a construction worker results in losses valued at $4 million, while a nonfatal injury involving days away from work costs approximately $42,000. These estimates include direct costs (such as payments for hospitals, physicians, medicines), indirect costs (wage losses and household production losses, costs of administering workers' compensation), and quality-of-life costs (value attributed to the pain and suffering that victims and their families experience as a result of injuries or illnesses).Five construction industries accounted for over half the total fatal and nonfatal injury costs: miscellaneous special trade contractors; plumbing, heating, and air-conditioning; electrical work; heavy construction except highway; and residential building construction. Each industry had $1.2 billion in costs or more (chart 48a).3 When examining only nonfatal injuries, four of those five industries were ranked highest in estimated costs: plumbing, heating, and air-conditioning; residential building
construction; miscellaneous special trade contractors; and electrical work. For fatal injuries, four of the five industries also were ranked as having the highest totals: miscellaneous special trade contractors; heavy construction except highway; electrical work; and residential building construction. Self-employed worker estimates were not included in the industry comparisons.
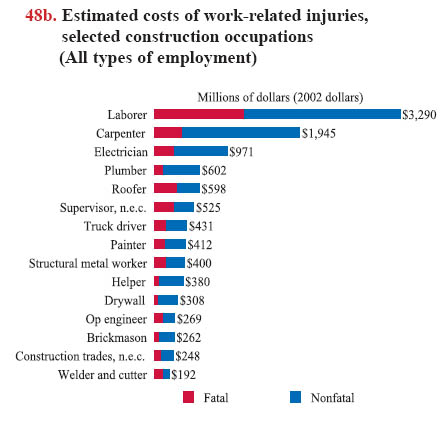
When costs by construction occupation were compared, self-employed construction workers (both incorporated and unincorporated) and those employed through temporary agencies were included.2 The incidence estimates for the self-employed were inflated using the average self-employment rate in each construction occupation obtained from the Current Population Survey (CPS). It is possible that some construction workers from temporary agencies may be reported under the temporary services industry, so the tabulations by occupation include both workers in the construction industry and those in construction trade occupations working in the temporary services industry.
Construction laborers and carpenters ranked the highest in costs for both fatal and nonfatal injuries in construction. The costs of fatal injuries for construction laborers and carpenters were over $1.2 billion and $376 million, respectively. For costs of nonfatal injuries, construction laborers accounted for almost $2.1 billion, and carpenters were about $1.6 billion (chart 48b). Cost variances can be explained by injury rates and severity, the number of workers, and wage differentials among construction industries and occupations. Several occupations, including roofers, construction laborers, and structural metal workers, ranked high for both total costs of injury and per-worker costs, suggesting that these occupations should be targeted for injury prevention programs and safety enforcement activities.
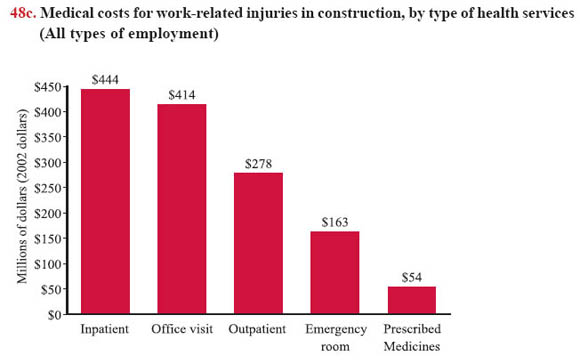
When analysis was restricted to expenditures on medical services, construction injuries cost about $1.36 billion annually. 4 The services for inpatients accounted for nearly one-third of the total medical costs, at $444 million per year (chart 48c). The estimates of medical costs are based on a large national population survey – the Medical Expenditure Panel Survey (MEPS), a unique data source providing information on health services and expenditures for various health conditions.
Download MS PowerPoint versions of Charts
1. All dollar values in the text are in 2002 dollars.
2. Geetha M. Waehrer, Xiuwen Dong, Ted R. Miller, Yurong Men, and Elizabeth Haile. 2007. Occupational Injury Costs and Alternative Employment in Construction Trades. Journal of Occupational and Environmental Medicine, 49(11):1218-1227.
3. Geetha M. Waehrer, Xiuwen Dong, Ted R. Miller, Elizabeth Haile, and Yurong Men. 2007. Costs of Occupational Injuries in Construction in the United States. Accident Analysis and Prevention, 39(6):1258-1266.
4. Xiuwen Dong, Knut Ringen, Yurong Men, and Alissa Fujimoto. 2007. Medical Costs and Sources of Payment for Work-Related Injuries among Hispanic Construction Workers. Journal of Occupational and Environmental Medicine, 49(12):1367-1375. Payments for over-the-counter drugs, alternative care services, and phone contacts with medical providers are not included in the MEPS total expenditure estimates. Indirect payments unrelated to specific medical events such as Medicaid Disproportionate Share and Medicare Direct Medical Education subsidies also are not included.
Note:
Chart 48a - The numbers are reported by the 1987 Standard Industrial Classification (SIC) system.
Chart 48b - For Supervisors and Construction trades, "n.e.c." stands for "not elsewhere classified."
Source:
Chart 48a - Geetha M. Waehrer, Xiuwen Dong, Ted R. Miller, Elizabeth Haile, and Yurong Men. 2007. Costs of Occupational Injuries in Construction in the United States. Accident Analysis and Prevention, 39(6):1258-1266. Chart
48b - Geetha M. Waehrer, Xiuwen Dong, Ted R. Miller, Yurong Men, and Elizabeth Haile. 2007. Occupational Injury Costs and Alternative Employment in Construction Trades. Journal of Occupational and Environmental Medicine, 49(11):1218-1227.
Chart 48c - Xiuwen Dong, Knut Ringen, Yurong Men, and Alissa Fujimoto. 2007. Medical Costs and Sources of Payment for Work-Related Injuries among Hispanic Construction Workers. Journal of Occupational and Environmental Medicine, 49(12):1367-1375.
Back to Table of Contents