
Asthma Mortality Among Persons Aged 15–64 Years, by Industry and Occupation — United States, 1999–2016
Summary Statement
CDC study of occupational respiratory health analyzes rates of worker deaths from asthma by industry and concludes that improved monitoring and surveillance of occupational exposures could significantly reduce asthma-related deaths. The study finds that among U.S. adults between 1999-2016, an estimated 3,664-6,994 asthma deaths (approx. 204-389 annually) could be attributed to occupational exposures. The study was published in Morbidity and Mortality Weekly Report (MMWR).
January 19, 2018
In 2015, an estimated 18.4 million U.S. adults had current asthma, and 3,396 adult asthma deaths were reported (1). An estimated 11%–21% of asthma deaths might be attributable to occupational exposures (2). To describe asthma mortality among persons aged 15–64 years,* CDC analyzed multiple cause-of-death data† for 1999–2016 and industry and occupation information collected from 26 states§ for the years 1999, 2003, 2004, and 2007– 2012. Proportionate mortality ratios (PMRs)¶ for asthma among persons aged 15–64 years were calculated. During 1999–2016, a total of 14,296 (42.9%) asthma deaths occurred among males and 19,011 (57.1%) occurred among females. Based on an estimate that 11%–21% of asthma deaths might be related to occupational exposures, during this 18-year period, 1,573–3,002 asthma deaths in males and 2,091–3,992 deaths in females might have resulted from occupational exposures. Some of these deaths might have been averted by instituting measures to prevent potential workplace exposures. The annual age-adjusted asthma death rate** per 1 million persons aged 15–64 years declined from 13.59 in 1999 to 9.34 in 2016 (p<0.001) among females, and from 9.14 (1999) to 7.78 (2016) (p<0.05) among males. The highest significantly elevated asthma PMRs for males were for those in the food, beverage, and tobacco products manufacturing industry (1.82) and for females were for those in the social assistance industry (1.35) and those in community and social services occupations (1.46). Elevated asthma mortality among workers in certain industries and occupations underscores the importance of optimal asthma management and identification and prevention of potential workplace exposures.
National Vital Statistics System’s multiple cause-of-death data for 1999–2016 were analyzed to examine asthma mortality among persons aged 15–64 years. Asthma deaths were identified from death certificates using International Classification of Diseases, 10th Revision underlying cause-of-death codes J45 (asthma) and J46 (status asthmaticus). Death rates per 1 million persons aged 15–64 years by sex, race, ethnicity, and year were age-adjusted using the 2000 U.S. Census standard population. Time trends were assessed using a first-order autoregressive linear regression model to account for the serial correlation. Industry and occupation information available from 26 states for the years 1999, 2003, 2004, and 2007–2012†† was coded§§ using the U.S. Census 2000 Industry and Occupation Classification System. PMRs, adjusted by 5-year age groups and race, were generated by industry and occupation for males and females. In addition, 95% confidence intervals (CIs) were calculated assuming Poisson distribution of the data. Retired, unemployed, and nonpaid workers and those with information that was unknown or not reported for industry or occupation were excluded from PMR analyses.
| Males | Females | Overall | ||||
|---|---|---|---|---|---|---|
| Characteristic | No.of deaths (% of asthma deaths) |
Death rate | No.of deaths (% of asthma deaths) |
Death rate | No.of deaths (% of asthma deaths) |
Death rate |
| Overall (% of all asthma deaths) | 14,296 (42.9) | 7.78 | 19,011 (57.1) | 9.95 | 33,307 (100.0) | 8.98 |
| Age group (yrs)¶ | ||||||
| 15–24 | 1,731 (12.1) | 4.42 | 1,035 (5.4) | 2.78 | 2,766 (8.3) | 3.62 |
| 25–34 | 2,272 (15.9) | 6.12 | 1,818 (9.6) | 4.97 | 4,090 (12.3) | 5.55 |
| 35–44 | 2,874 (20.1) | 7.55 | 3,692 (19.4) | 9.60 | 6.566 (19.7) | 8.58 |
| 45–54 | 3,853 (27.0) | 10.28 | 6,284 (33.1) | 16.22 | 10,137 (30.4) | 13.30 |
| 55–64 | 3,566 (24.9) | 12.39 | 6,182 (32.5) | 19.98 | 9,748 (29.3) | 16.32 |
| Race** | ||||||
| American Indian or Alaska Native | 138 (1.0) | 6.28 | 198 (1.0) | 9.15 | 336 (1.0) | 7.75 |
| Asian or Pacific Islander | 525 (3.7) | 5.67 | 439 (2.3) | 4.23 | 964 (2.9) | 4.92 |
| Black or African American | 5,695 (39.8) | 25.21 | 6,463 (34.0) | 285.76 | 12,158 (36.5) | 25.60 |
| White | 3,566 (24.9) | 12.39 | 6,182 (32.5) | 19.98 | 9,748 (29.3) | 16.32 |
| Ethnicity†† | ||||||
| Hispanic or Latino | 1,348 (9.4) | 5.49 | 1,474 (7.8) | 6.37 | 2,822 (8.5) | 5.96 |
| Not Hispanic or Latino | 12,862 (90.0) | 8.21 | 17,468 (91.9) | 10.48 | 30,330 (91.1%) | 9.39 |
| Unknown | 86 (0.6) | N/A | 69 (0.4) | N/A | 155 (0.5) | N/A |
| Year | ||||||
| 1999 | 824 | 9.14 | 1,257 | 13.59 | 2,081 | 11.41 |
| 2000 | 878 | 9.60 | 1,150 | 12.24 | 2,028 | 10.95 |
| 2001 | 792 | 8.47 | 1,192 | 12.41 | 1,984 | 10.49 |
| 2002 | 872 | 9.14 | 1,148 | 11.71 | 2,020 | 10.49 |
| 2003 | 828 | 8.54 | 1,162 | 11.62 | 1,990 | 10.12 |
| 2004 | 770 | 7.82 | 1,044 | 10.21 | 1,814 | 9.06 |
| 2005 | 720 | 7.21 | 1,102 | 10.59 | 1,822 | 8.96 |
| 2006 | 721 | 7.12 | 1,039 | 9.81 | 1,760 | 8.52 |
| 2007 | 745 | 7.22 | 908 | 8.51 | 1,653 | 7.89 |
| 2008 | 667 | 6.47 | 931 | 8.54 | 1,598 | 7.52 |
| 2009 | 699 | 6.69 | 996 | 9.08 | 1,695 | 7.92 |
| 2010 | 747 | 7.04 | 982 | 8.86 | 1,729 | 7.97 |
| 2011 | 732 | 6.82 | 953 | 8.45 | 1,685 | 7.67 |
| 2012 | 850 | 7.91 | 988 | 8.71 | 1,838 | 8.31 |
| 2013 | 852 | 8.01 | 999 | 8.77 | 1,851 | 8.43 |
| 2014 | 875 | 8.19 | 1,089 | 9.63 | 1,964 | 8.94 |
| 2015 | 885 | 8.14 | 997 | 8.65 | 1,882 | 8.43 |
| 2016 | 839 | 7.78 | 1,074 | 9.34 | 1,913 | 8.60 |
| p-value§§ | 0.72 | <0.05 | 0.004 | <0.001 | 0.11 | <0.001 |
| Abbreviation: N/A = not available. * Decedents who had International Classification of Diseases, 10th Revision codes J45 (asthma) or J46 (status asthmaticus) assigned as the underlying cause of death (i.e., the disease or injury that initiated the chain of morbid events leading directly to death, or the circumstances of the accident or violence that produced the fatal injury). † Age-adjusted asthma death rates per 1 million persons calculated using the 2000 U.S. Census standard population. § National Vital Statistics System. https://wonder.cdc.gov/. ¶ Age-specific asthma death rates per 1 million persons. ** Race and Hispanic origin are reported separately on the death certificate in accordance with standards set forth by the Office of Management and Budget. The American Indian or Alaska Native race category includes: North, Central, and South American Indians, Eskimos, and Aleuts. The Asian or Pacific Islander race category includes Chinese, Filipino, Hawaiian, Japanese, and Other Asian or Pacific Islanders. https://wonder.cdc.gov/wonder/help/mcd.html. †† Deaths with Hispanic origin not stated are excluded from death rates calculation by Hispanic origin. §§ For 1999–2016 linear time trend (examined using a first-order autoregressive linear regression model to account for the serial correlation). |
||||||
* Age-adjusted death rates were calculated by applying
age-specific death rates
to the 2000 U.S. Census standard
population age distribution. https://wonder.cdc.gov/
wonder/help/mcd.html#Age-Adjusted Rates.
† Decedents aged 15–64
years for whom the International
Classification of
Diseases, 10th Revision codes J45
(asthma) or J46 (status asthmaticus) were
listed on death
certificates as the
underlying cause of death.
§ States represent the place of legal residence at the
time
of death.
¶ National Vital Statistics System. https://wonder.cdc.gov/.
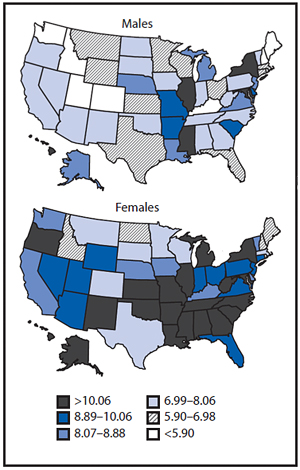
During 1999–2016, a total of 33,307 U.S. decedents aged 15–64 years had asthma or status asthmaticus assigned as the underlying cause of death (Table 1) for an overall death rate of 8.89 per 1 million persons. The highest asthma death rates were among adults aged 55–64 years (16.32 per 1 million persons), females (9.95 per 1 million persons), persons who were not Hispanic or Latino (9.39 per 1 million), and blacks or African Americans (25.60 per 1 million persons). The age-adjusted asthma death rate per 1 million persons aged 15–64 years decreased 24.6% from 11.41 in 1999 to 8.60 in 2016 (p<0.01). The age-adjusted asthma death rates among females aged 15–64 years decreased from 13.59 per 1 million in 1999 to 9.34 in 2016 (p<0.001), and among males decreased from 9.14 (1999) to 7.78 (2016) (p<0.05). By state, annualized age-adjusted asthma death rates ranged from 4.59 per 1 million in Maine to 14.72 in the District of Columbia for males and from 6.70 per 1 million in North Dakota to 15.30 in Mississippi for females (Figure).
Industry and occupation data were available for 3,393¶¶ (97.2%) of 3,491 asthma deaths, (1,398 of 1,435 [97.4%] males and 1,995 of 2,056 [97.0%] females) among persons aged 15–64 years that occurred in residents of 26 states during 1999, 2003, 2004, and 2007–2012 (Table 2). By industry, the highest number of asthma deaths occurred among males in the construction industry (184; 13.2% of asthma deaths in males) and among females in the health care industry (279; 14.0% of asthma deaths in females). By occupation, the highest number of asthma deaths occurred among male construction trades workers (149; 10.7%) and among female office and administrative support workers (186; 9.3%). By industry, PMRs were significantly elevated among males working in food, beverage, and tobacco products manufacturing (1.82; CI = 1.22–2.61), other retail trade (1.65; CI = 1.29–2.10), and miscellaneous manufacturing (1.45; CI = 1.13–1.86); and among females working in social assistance (e.g., individual and family services and child day care services) (1.35; CI = 1.00–1.79). By occupation, the PMR was significantly elevated among female community and social services workers (1.46; CI = 1.02–2.01).
| Characteristic | No. of deaths | PMR§,¶(95% CI) |
|---|---|---|
| Industry | ||
| Male (n = 1,079) | ||
| Food, beverage, and tobacco products manufacturing | 29 | 1.82 (1.22–2.61)** |
| Other retail trade | 69 | 1.65 (1.29–2.10)** |
| Miscellaneous manufacturing | 66 | 1.45 (1.13–1.86)** |
| Arts, entertainment and recreation | 29 | 1.30 (0.88–1.87) |
| Public administration | 52 | 1.09 (0.83–1.45) |
| Health care | 40 | 1.04 (0.74–1.42) |
| Repair and mainenance | 46 | 1.01 (0.73–1.34) |
| Professional, scientific, technical and mangement services | 34 | 1.00 (0.69–1.39) |
| Transportation and warehousing | 89 | 0.98 (0.79–1.21) |
| Accommodation and food services | 66 | 0.96 (0.75–1.23) |
| Educational services | 29 | 0.95 (0.64–1.37) |
| Construction | 184 | 0.92 (0.79–1.07) |
| Transportation equipment | 28 | 0.78 (0.52–1.12) |
| Administrative and support, and waste management services | 36 | 0.66 (0.46–0.91) |
| All other industries | 282 | — |
| Female (n = 1,230) | ||
| Social assistance | 49 | 1.35 (1.00–1.79)** |
| Arts, entertainment and recreation | 26 | 1.29 (0.84–1.89) |
| Food and beverage stores | 27 | 1.19 (0.78–1.73) |
| Private households | 31 | 1.16 (0.79–1.64) |
| Health care | 279 | 1.12 (1.00–1.27) |
| Other retail trade | 96 | 1.10 (0.89–1.34) |
| Public administration | 69 | 1.06 (0.83–1.35) |
| Accommodation and food services | 116 | 1.01 (0.84–1.21) |
| Administrative and support, and waste management services | 42 | 0.97 (0.70–1.31) |
| Transportation and warehousing | 37 | 0.90 (0.63–1.24) |
| Finance and Insurance | 48 | 0.90 (0.66–1.19) |
| Personal and laundry services | 29 | 0.86 (0.58–1.24) |
| Educational services | 94 | 0.85 (0.69–1.04) |
| Miscellaneous manufacturing | 29 | 0.75 (0.50–1.07) |
| Professional, scientific, technical and management services | 35 | 0.66 (0.46–0.92) |
| All other industries | 223 | — |
| Occupation | ||
| Male (n = 1,087) | ||
| Office and administrative support occupations | 62 | 1.25 (0.97–1.61) |
| Other production occupations, including supervisors | 51 | 1.21 (0.91–1.61) |
| Sales and related occupations | 89 | 1.17 (0.95–1.45) |
| Laborers and material movers, hand | 92 | 1.09 (0.88–1.34) |
| Motor vehicle operators | 74 | 1.07 (0.85–1.36) |
| Metal workers and plastic workers | 35 | 0.95 (0.66–1.33) |
| Food preparation and serving related occupations | 46 | 0.91 (0.66–1.21) |
| Construction trades workers | 149 | 0.89 (0.76–1.05) |
| Management occupations, except agricultural | 61 | 0.89 (0.69–1.15) |
| Building and grounds cleaning and maintenance occupations | 54 | 0.88 (0.67–1.16) |
| Electrical equipment mechanics and other installation, maintenance, and repair workers | 26 | 0.85 (0.56–1.25) |
| Vehicle and mobile equipment mechanics, installers, and repairers | 32 | 0.82 (0.56–1.15) |
| All other occupations | 316 | — |
| Female (n = 1,239) | ||
| Community and social services occupations | 36 | 1.46 (1.02–2.01)** |
| Laborers and material movers, hand | 47 | 1.19 (0.88–1.59) |
| Healthcare support occupations | 110 | 1.15 (0.95–1.39) |
| Food preparation and serving related occupations | 100 | 1.12 (0.92–1.37) |
| Personal care and service occupations | 75 | 1.09 (0.87–1.38) |
| Sales and related occupations | 134 | 1.09 (0.92–1.30) |
| Health diagnosing and treating practitioners and technical occupations | 59 | 1.00 (0.77–1.31) |
| Building and grounds cleaning and maintenance occupations | 62 | 1.00 (0.78–1.30) |
| Management occupations, except agricultural | 85 | 0.99 (0.80–1.24) |
| Business operations specialists | 25 | 0.96 (0.62–1.42) |
| Education, training, and library occupations | 70 | 0.93 (0.73–1.18) |
| Health technologists and technicians | 28 | 0.91 (0.61–1.32) |
| Office and administrative support occupations | 186 | 0.90 (0.77–1.04) |
| All other occupations | 222 | — |
| Abbreviations: CI = confidence interval; PMR = proportionate mortality ratio. * Decedents who had the International Classification of Diseases, 10th Revision codes J45 (asthma) or J46 (status asthmaticus) assigned as the underlying cause of death (i.e., the disease or injury that initiated the chain of morbid events leading directly to death, or the circumstances of the accident or violence that produced the fatal injury). † Colorado, Florida, Georgia, Hawaii, Idaho, Indiana, Kansas, Kentucky, Louisiana, Michigan, Nebraska, Nevada, New Hampshire, New Jersey, New Mexico, North Carolina, North Dakota, Ohio, Rhode Island, South Carolina, Texas, Utah, Vermont, Washington, West Virginia, and Wisconsin. States represent the state where the death took place. § PMR is defined as the observed number of deaths from asthma in a specified industry/occupation, divided by the expected number of deaths from asthma. The expected number of deaths is the total number of deaths in industry or occupation of interest multiplied by a proportion defined as the number of asthma deaths in all industries or occupations, divided by the total number of deaths in all industries/occupations. The asthma PMRs were internally adjusted by 5-year age groups and race. CIs were calculated assuming Poisson distribution of the data. ¶ Retired, unemployed, and unpaid (229 males and 687 females) and unknown or not reported (90 males and 78 females) workers in industries, and retired, students, volunteers, homemakers and unemployed (233 males and 688 females) and unknown or not reported (78 males and 68 females) occupations were excluded from PMR analyses. ** Statistically significant elevated PMR |
||
Discussion
The annual number of asthma deaths among persons aged 15–64 years has declined significantly from 1999 through 2016, most likely reflecting improvements in asthma management and effectiveness of prevention efforts (3,4). For example, replacing powdered latex gloves with powder-free natural rubber latex or nonlatex gloves reduced latex allergen exposure and substantially reduced work-related asthma*** among health care workers (4). Differences in asthma mortality by age, sex, and race/ethnicity have been previously reported (5). Based on an estimate that 11%–21% of asthma deaths might be attributable to occupational exposures (2), an estimated 3,664–6,994 asthma deaths during 1999–2016 (1,573–3,002 among males and 2,091–3,992 among females) might have been job-related, and therefore potentially preventable.
Female workers in the health care industry and male workers in the construction industry accounted for the highest industry-related numbers of asthma deaths. The PMRs were significantly elevated among males in the food, beverage, and tobacco products manufacturing, other retail trade, and miscellaneous manufacturing industries; and among females in the social assistance industry and in the community and social services occupations. A higher proportion of females with current asthma and a high frequency of exposures associated with workrelated respiratory diseases have been observed in the health care and social assistance industries (6,7). National survey data indicate that approximately 9.1% (1.3 million) of 13.9 million female workers in the health care and social assistance industries, and 4.2% (394,000) of 9.4 million male workers in the construction industry, have current asthma.††† Approximately 13.4% of health care and social assistance workers, 51.1% of construction workers, 31.8% of food manufacturing workers, 36.1% of beverage and tobacco product manufacturing workers, 40.0% of miscellaneous manufacturing workers, 21.5% of retail trade workers, and 3.7% of community and social services workers are frequently exposed to vapors, gas, dust, or fumes in the workplace (6). Workplace exposures to asthma-causing agents,§§§ such as cleaners, disinfectants, antibiotics, natural rubber latex among health care workers, and welding fumes and isocyanates (e.g., paints) among construction workers¶¶¶ have been associated with work-related asthma (8,9). Higher PMRs in certain groups might also be explained in part by workers leaving employment in industries and occupations with workplace exposures that exacerbate their asthma and moving to jobs with fewer workplace exposures (10). Likewise, retired, unemployed, and nonpaid workers might have left the workforce because of workplace exposures.
Differences in asthma mortality by industry and occupation underscore the need for identifying workplace exposures, early diagnosis, and treatment and management of asthma cases, especially among industries and occupations with higher mortality. Pharmaceutical treatment of asthma related to occupational exposures is similar to that for asthma that is not work-related (3). Early identification and elimination of exposures is the preferred means of primary prevention to reduce asthma related to occupational exposures; however, reduction of exposure might be considered when elimination of exposures is not possible (4). Establishing an accurate diagnosis and recommending appropriate management for workers with asthma related to occupational exposures is necessary to improve outcomes and could prevent asthma deaths (4).
The findings in this report are subject to at least five limitations. First, asthma and status asthmaticus diagnoses could not be validated. It is possible that some decedents were misdiagnosed. However, given the potential impact of asthma diagnosis and status asthmaticus on patients’ lives, it seems likely that asthma would be accurately recorded on death certificates. Second, no information was available to assess whether workplace exposures triggered asthma attacks that led directly to death. Some attacks might have been triggered by exposures outside of the work environment. Third, to the extent that asthma attacks were triggered by workplace exposures, industry and occupation information reported on death certificates might not be the industry and occupation in which workplace exposures actually occurred because guidelines for reporting industry and occupation on death certificates**** instruct recorders to report decedent’s “usual” industry and occupation (i.e., “the type of job the individual was engaged in for most of his or her working life”). Fourth, no work history was available to assess changes in employment. Retired and unemployed persons might have left the workforce because of severe asthma in relation to work. Finally, information on industry and occupation might not be nationally representative because only selected states provided information on industry and occupation, and only for certain years.
Effective asthma management tools are available from CDC at https://www.cdc.gov/asthma/tools_for_control.htm, and information on the evaluation and treatment of asthma is available from the American Thoracic Society at https://www. thoracic.org/statements/allergy-asthma.php. Additional guidance for diagnosing work-related asthma is available from the Occupational Safety and Health Administration at https:// www.osha.gov/SLTC/occupationalasthma/. The elevated asthma mortality among workers in certain industries and occupations underscores the importance of optimal asthma management, and identification and elimination or reduction of potential workplace exposures (3,4,9).
Acknowledgments
Eileen Storey, MD, Respiratory Health Division, National Institute for Occupational Safety and Health, CDC; Carol Johnson, MPH, Division of Environmental Hazards and Health Effects, National Center for Environmental Health, CDC; Vital Statistics Offices from the following 26 states providing industry and occupation information: Colorado, Florida, Georgia, Hawaii, Idaho, Indiana, Kansas, Kentucky, Louisiana, Michigan, Nebraska, Nevada, New Hampshire, New Jersey, New Mexico, North Carolina, North Dakota, Ohio, Rhode Island, South Carolina, Texas, Utah, Vermont, Washington, West Virginia, and Wisconsin.
Conflict of Interest
No conflicts of interest were reported.
Summary
What is already known about this topic?
In 2015, a total of 3,396 asthma deaths were reported among adults aged ≥18 years in the United States. An estimated 11%–21% of asthma deaths might be attributable to occupational exposures. Asthma deaths are preventable with proper asthma management and rapid response to asthma attacks.
What is added by this report?
Among U.S. adults aged 15–64 years, 33,307 deaths from asthma occurred during 1999–2016, including an estimated 3,664–6,994 (approximately 204–389 annually) that could be attributable to occupational exposures and were therefore potentially preventable. The highest asthma death rates were among adults aged 55–64 years, females, persons who were not Hispanic or Latino, and blacks or African Americans. By industry, asthma mortality was significantly elevated among males in food, beverage, and tobacco products manufacturing, other retail trade, and miscellaneous manufacturing, and among females in social assistance. By occupation, asthma mortality was significantly elevated among females in community and social services.
What are the implications for public health practice?
Elevated asthma mortality among male and female workers in certain industries and occupations highlights the importance of optimal asthma management, and identification and prevention of workplace exposures.
References
- CDC. Asthma: most recent asthma data. 2017. Atlanta, GA: US Department of Health and Human Services, CDC; 2017. https://www. cdc.gov/asthma/most_recent_data.htm
- Steenland K, Burnett C, Lalich N, Ward E, Hurrell J. Dying for work: the magnitude of US mortality from selected causes of death associated with occupation. Am J Ind Med 2003;43:461–82. https://doi.org/10.1002/ ajim.10216
- National Asthma Education and Prevention Program. Expert panel report 3 (EPR-3): guidelines for the diagnosis and management of asthma—summary report 2007. J Allergy Clin Immunol 2007;120(Suppl):S94–138. https://doi.org/10.1016/j.jaci.2007.09.029
- Heederik D, Henneberger PK, Redlich CA; ERS Task Force on the Management of Work-related Asthma. Primary prevention: exposure reduction, skin exposure and respiratory protection. Eur Respir Rev 2012;21:112–24. https://doi.org/10.1183/09059180.00005111
- Moorman JE, Akinbami LJ, Bailey CM, et al. National surveillance of asthma: United States, 2001–2010. Vital Health Stat 3 2012;35:1–58.
- Calvert GM, Luckhaupt SE, Sussell A, Dahlhamer JM, Ward BW. The prevalence of selected potentially hazardous workplace exposures in the US: findings from the 2010 National Health Interview Survey. Am J Ind Med 2013;56:635–46. https://doi.org/10.1002/ajim.22089
- White GE, Seaman C, Filios MS, et al. Gender differences in work-related asthma: surveillance data from California, Massachusetts, Michigan, and New Jersey, 1993–2008. J Asthma 2014;51:691–702. https://doi.org/1 0.3109/02770903.2014.903968
- Baur X, Bakehe P, Vellguth H. Bronchial asthma and COPD due to irritants in the workplace - an evidence-based approach. J Occup Med Toxicol 2012;7:19. https://doi.org/10.1186/1745-6673-7-19
- Tarlo SM, Balmes J, Balkissoon R, et al. Diagnosis and management of work-related asthma: American College Of Chest Physicians consensus statement. Chest 2008;134(Suppl):1S–41S. https://doi.org/10.1378/ chest.08-0201
- Le Moual N, Kauffmann F, Eisen EA, Kennedy SM. The healthy worker effect in asthma: work may cause asthma, but asthma may also influence work. Am J Respir Crit Care Med 2008;177:4–10. https:// doi.org/10.1164/rccm.200703-415PP
Notes
* https://www.dol.gov/general/topic/youthlabor/agerequirements.
† Decedents who had the International Classification of Diseases, 10th Revision codes J45 (asthma) or J46 (status asthmaticus) assigned as the underlying cause of death (the disease or injury that initiated the chain of events that led directly and inevitably to death). https://wonder.cdc.gov/.
§ Colorado, Florida, Georgia, Hawaii, Idaho, Indiana, Kansas, Kentucky, Louisiana, Michigan, Nebraska, Nevada, New Hampshire, New Jersey, New Mexico, North Carolina, North Dakota, Ohio, Rhode Island, South Carolina, Texas, Utah, Vermont, Washington, West Virginia, and Wisconsin. States represent the state where the death took place.
¶ PMR was defined as the observed number of deaths from asthma in a specified industry/occupation, divided by the expected number of deaths from asthma. The expected number of deaths was the total number of deaths in industry or occupation of interest multiplied by a proportion defined as the number of asthma deaths in all industries and/or occupations, divided by the total number of deaths in all industries/occupations. The asthma PMRs for each sex were internally adjusted by 5-year age groups and race.
** Age-adjusted death rates were calculated by applying age-specific death rates to the 2000 U.S. Census standard population age distribution. https://wonder. cdc.gov/wonder/help/mcd.html#Age-AdjustedRates.
†† Information on industry and occupation was available only for decedents from 26 states for the years 1999, 2003, 2004, and 2007–2012. https://www.cdc. gov/niosh/topics/noms/default.html.
§§ https://webappa.cdc.gov/ords/norms-glossary.html#ind-occ.
¶¶ For 98 residents of these 26 states, deaths occurred in states that did not provide the industry and occupation information to the National Institute for Occupational Safety and Health. Retired, unemployed, and non-paid (229 males and 687 females) and unknown or not reported (90 males and 78 females) industries, and retired, students, volunteers, homemakers and unemployed (233 males and 688 females) and unknown or not reported (78 males and 68 females) occupations were excluded from PMR analyses.
*** Work-related asthma includes occupational asthma (i.e., new-onset asthma caused by factors related to work) and work-exacerbated asthma (i.e., preexisting or concurrent asthma worsened by factors related to work). https://www.cdc.gov/niosh/topics/asthma/default.html.
††† https://wwwn.cdc.gov/eworld/Grouping/Asthma/97.
§§§ Association of Occupational and Environmental Clinics list of occupational asthmagens. http://www.aoecdata.org/ExpCodeLookup.aspx.
¶¶¶ Occupational Safety and Health Administration. Health Hazards in Construction. https://www.osha.gov/dte/grant_materials/fy09/sh-19495-09/ health_hazards_workbook.pdf.
**** https://www.cdc.gov/nchs/data/misc/hb_occup.pdf.
Authors: Opal Patel, MPH1,2; Girija Syamlal, MBBS2; John Wood, MS2; Katelynn E. Dodd, MPH2; Jacek M. Mazurek, MD, PhD2
Corresponding author: Jacek M. Mazurek, jmazurek1@cdc.gov, 304-285-5983.
MMWR / January 19, 2018 / Vol. 67 / No. 2
US Department of Health and Human Services/Centers for Disease Control and Prevention
1Association of Schools and Programs of Public Health/CDC Public Health Fellowship Program;
2Respiratory Health Division, National Institute for Occupational Safety and Health, CDC.