Workplace Safety Climate Surveys for City Center and Cosmopolitan Construction Projects, Las Vegas, Nevada (Final Report)
-
Las Vegas Projects - Assessment and Audit
The following are links to all of the items in this collection:
Documents
- Fall Hazard Identification and Control Audit of the Aria Building, City Center Project, Las Vegas Nevada
- Fall Hazard Identification and Control Audit of the Mandarin Building, City Center Project, Las Vegas Nevada
- Worksite Assessment Team Site Visit Report for City Center and Cosmopolitan Construction Projects, Las Vegas Nevada
- Workplace Safety Climate Surveys for City Center and Cosmopolitan Construction Projects, Las Vegas, Nevada (Final Report)
Summary Statement
The worksite assessment was conducted in response to work-related fatalities. The primary purpose of the visit was to better understand safety management and programs used by general contractor at both the City Center and Cosmopolitan construction projects and to provide constructive feedback to improve safety and health on these projects. During the site visit, an average of 7,200 employees (day shift) in multiple crafts worked at the site. Part of a collection. Click on the 'collection' button to access the other items.
January 2009
Acknowledgments
Detailed contents of the Final Report
A. Introduction
B. Methods
C. Results
Appendices
References
C. RESULTS
1. Construction Workers
1-1. Descriptive Analysis
1-1-a. Demographics
The final analysis of the worker safety climate surveys consists of responses from a total of 3,035 workers. The surveys were conducted during OSHA 10 hour training between July and October, 2008. Of the workers completing the survey 2,716 (89%) completed the English version and 319 (11%) completed the Spanish version. One thousand six hundred and twenty nine surveys (54%) were completed by workers at City Center and 1,406 (46%) were completed by workers at Cosmopolitan . Figure 1 below shows the distribution of workers by age, ranging from fourteen years of age to eighty-seven years of age. The average age of those who responded was 38.9 years (SD=11.3 years). We were unable to identify the trade or employer of the 14 year old apprentice who works for a subcontractor. The 87 year old was a journeyman plumber with 50 years of experience in the construction industry.
Figure 1. Distribution of Construction Workers by Age

Figure 2 shows the distribution of workers by trade for both the City Center and Cosmopolitan sites who participated in the climate survey. Carpenters, plumbers and pipe fitters, electricians, sheet metal workers, and laborers represented the highest percentages of participation. They represented 78% of the trades who participated in the survey.
Figure 2. Distribution of Construction Workers by Trade

Figure 3 illustrates the geographic spread of workers' home locals. Workers on the two sites come from states across the country with the majority of workers coming from NV, CA, AZ, MI, TX, FL, and IL.
Figure 3. Distribution of Construction Workers by Home Local

Figure 4 shows the distribution of workers by race. Forty-five percent were Caucasian, a third (34%) were Hispanic, 7% were African American, and 3% were Native American.
Figure 4. Distribution of Construction Workers by Race / Ethnicity
Figure 5 describes the work status of survey participants. Five hundred and seventeen workers who responded to the safety climate survey were Apprentices (17%) and 2,337(77%) were Journeymen.
Figure 5. Distribution of Construction Workers by Work Status

Figure 6 shows the number of months worked at City Center or Cosmopolitan worksites at the time workers completed the survey. Nine hundred and five (30%) were on the job less than three months and 1,925 (63%) were on-site for three months or more. The average number of months on the job was 5.8 months (SD = 5.4 months). Of the 3,035 workers, 17 reported they worked >30 months on the job. We categorized these individuals as having worked 30 months instead of excluding them from the analysis.
Figure 6. Months Worked at City Center or Cosmopolitan Projects by Workers

Figure 7 shows the distribution of self-reported years worked in the construction industry by workers who completed the survey. The average number of years worked was 16.0 years (SD=11.0 years). The number of years worked ranged from 0 to 57.
Figure 7. Distribution of Years Worked in the Construction Industry by Workers

1-1-b. Item-Specific Responses
Table 1 describes the frequency of responses for each category of the 6 point likert scale for each of the climate survey questions answered by workers. Selected highlights are presented at the end of Table 1.
Table 1. Item-Specific Responses to Safety Climate Survey Questions-Worker Responses
Questions |
Strongly Disagree |
Disagree |
Somewhat Disagree |
Somewhat Agree |
Agree |
Strongly Agree |
Missing |
Mean |
1. Safety is visible on this job – for example, I have seen safety personnel or site supervisors or site management doing daily safety checks |
108 (4%) |
163 (5%) |
200 (7%) |
578 (19%) |
1,271 (42%) |
575 (19%) |
140 (5%) |
4.54 ± 1.25 |
2. The General Contractor (Perini) thinks that job site safety is more important than job schedules and deadlines |
202 (7%) |
268 (9%) |
338 (11%) |
728 (24%) |
902 (30%) |
450 (15%) |
147 (5%) |
4.11 ± 1.43 |
3. Perini safety personnel step in to stop unsafe operations |
122 (4%) |
203 (7%) |
253 (8%) |
683 (23%) |
1,118 (37%) |
486 (16%) |
170 (6%) |
4.37 ± 1.30 |
4. Perini thinks that safety is more important than productivity |
158 (5%) |
275 (9%) |
355 (12%) |
821 (27%) |
825 (27%) |
419 (14%) |
182 (6%) |
4.10 ± 1.37 |
5. The Perini safety staff follows up when there is a problem - it gets fixed right away and stays that way |
146 (5%) |
212 (7%) |
344 (11%) |
912 (30%) |
867 (29%) |
348 (11%) |
206 (7%) |
4.13 ± 1.29 |
6. Perini likes to get safety reports/feedback from workers like me |
239 (8%) |
330 (11%) |
369 (12%) |
722 (24%) |
828 (27%) |
328 (11%) |
219 (7%) |
3.91 ± 1.45 |
7. My subcontractor's safety program works well together with Perini – it is clear to me who is responsible for what |
147 (5%) |
249 (8%) |
329 (11%) |
738 (24%) |
965 (32%) |
380 (13%) |
227 (7%) |
4.16 ± 1.34 |
8. Perini believes that schedule is the most important issue on this project |
169 (6%) |
391 (13%) |
444 (15%) |
745 (25%) |
707 (23%) |
329 (11%) |
250 (8%) |
3.87 ± 1.41 |
9. Perini cares for my safety on this job |
115 (4%) |
129 (4%) |
214 (7%) |
711 (23%) |
1,055 (35%) |
639 (21%) |
172 (6%) |
4.53 ± 1.26 |
10. Safety is important to the subcontractor I currently work for – he or she mentions it often when talking to crews on site |
72 (2%) |
108 (4%) |
146 (5%) |
520 (17%) |
1,159 (38%) |
834 (27%) |
196 (6%) |
4.79 ± 1.18 |
11. My foreman has the safety knowledge needed for the hazards we face on this job |
73 (2%) |
85 (3%) |
106 (3%) |
429 (14%) |
1,200 (40%) |
978 (32%) |
164 (5%) |
4.93 ± 1.14 |
12. My foreman makes sure we follow site safety rules and procedures very closely |
66 (2%) |
79 (3%) |
123 (4%) |
408 (13%) |
1,171 (39%) |
1,032 (34%) |
156 (5%) |
4.96 ± 1.13 |
13. My foreman wants us to inform him/her of any safety problems so they can get them fixed or reported to others |
51 (2%) |
62 (2%) |
84 (3%) |
322 (11%) |
1,238 (41%) |
1,121 (37%) |
157 (5%) |
5.08 ± 1.04 |
14. If my foreman is unsure of a safety question, he or she always calls in a safety specialist |
95 (3%) |
148 (5%) |
118 (4%) |
458 (15%) |
1,220 (40%) |
806 (27%) |
190 (6%) |
4.75 ± 1.25 |
15. My foreman thinks that safety is more important than productivity |
89 (3%) |
131 (4%) |
157 (5%) |
488 (16%) |
1,127 (37%) |
852 (28%) |
191 (6%) |
4.75 ± 1.24 |
16. My foreman thinks that productivity is more important than safety |
651 (21%) |
831 (27%) |
425 (14%) |
413 (14%) |
300 (10%) |
174 (6%) |
241 (8%) |
2.79 ± 1.52 |
17. My subcontractor's safety program works well together with other subcontractor's safety programs |
68 (2%) |
119 (4%) |
175 (6%) |
700 (23%) |
1,215 (40%) |
506 (17%) |
252 (8%) |
4.58 ± 1.13 |
18. My foreman stops work if working conditions are unsafe, even if we have a deadline |
83 (3%) |
156 (5%) |
160 (5%) |
418 (14%) |
1,153 (38%) |
841 (28%) |
224 (7%) |
4.75 ± 1.26 |
19. I work too many hours per week on this job |
1,074 (35%) |
1,067 (35%) |
261 (9%) |
197 (6%) |
147 (5%) |
75 (2%) |
214 (7%) |
2.11 ± 1.28 |
20. Fatigue is an issue for me – I have caught myself making mistakes on the job when I was tired |
951 (31%) |
999 (33%) |
266 (9%) |
266 (9%) |
234 (8%) |
117 (4%) |
202 (7%) |
2.36 ± 1.44 |
21. Doing the work safely on this job has definite priority over getting it done on schedule |
129 (4%) |
164 (5%) |
232 (8%) |
454 (15%) |
984 (32%) |
865 (29%) |
207 (7%) |
4.62 ± 1.38 |
22. Sometimes I don't report a hazard because there isn't time to stop work or the work task is of too short a duration, so I work around the hazard |
912 (30%) |
1,002 (33%) |
289 (10%) |
290 (10%) |
230 (8%) |
119 (4%) |
193 (6%) |
2.40 ± 1.44 |
23. Sometimes I can't do my job safely because other trades are in my way |
346 (11%) |
573 (19%) |
260 (9%) |
564 (19%) |
684 (23%) |
395 (13%) |
213 (7%) |
3.66 ± 1.64 |
24. There is always enough personal protective equipment available to allow work to be done safely |
135 (4%) |
169 (6%) |
195 (6%) |
415 (14%) |
1,163 (38%) |
756 (25%) |
202 (7%) |
4.61 ± 1.36 |
25. I have received enough training to do my work safely |
49 (2%) |
71 (2%) |
99 (3%) |
306 (10%) |
1,305 (43%) |
1,024 (34%) |
181 (6%) |
5.04 ± 1.05 |
26. I always get enough site-specific information about a job to do it safely |
70 (2%) |
109 (4%) |
202 (7%) |
515 (17%) |
1,224 (40%) |
701 (23%) |
214 (7%) |
4.71 ± 1.17 |
27. I know what my safety responsibilities are at work |
35 (1%) |
33 (1%) |
51 (2%) |
231 (8%) |
1,304 (43%) |
1,157 (38%) |
224 (7%) |
5.21 ± 0.91 |
28. Sometimes I ignore a safety rule or policy in order to carry out an assignment to meet the schedule |
863 (28%) |
853 (28%) |
284 (9%) |
345 (11%) |
338 (11%) |
119 (4%) |
233 (8%) |
2.57 ± 1.53 |
29. I always report safety hazards that I see |
80 (3%) |
122 (4%) |
162 (5%) |
447 (15%) |
1,203 (40%) |
815 (27%) |
206 (7%) |
4.77 ± 1.21 |
30. I know who to report a hazard to when I see one on the job |
67 (2%) |
69 (2%) |
77 (3%) |
230 (8%) |
1,349 (44%) |
1,021 (34%) |
222 (7%) |
5.06 ± 1.07 |
31. I assist others to make sure they perform their work safely |
49 (2%) |
55 (2%) |
72 (2%) |
426 (14%) |
1,358 (45%) |
845 (28%) |
230 (8%) |
4.97 ± 1.01 |
32. Toolbox talks about safety are given regularly |
105 (3%) |
106 (3%) |
104 (3%) |
249 (8%) |
1,146 (38%) |
1,086 (36%) |
239 (8%) |
4.96 ± 1.25 |
33. Toolbox talks are helpful to me |
68 (2%) |
85 (3%) |
127 (4%) |
438 (14%) |
1,168 (38%) |
898 (30%) |
251 (8%) |
4.88 ± 1.15 |
34. Other workers care about my safety, and I care about theirs |
75 (2%) |
80 (3%) |
123 (4%) |
443 (15%) |
1,149 (38%) |
928 (31%) |
237 (8%) |
4.89 ± 1.16 |
35. I believe that safety committees for the project would be very beneficial |
55 (2%) |
68 (2%) |
94 (3%) |
473 (16%) |
1,104 (36%) |
1,002 (33%) |
239 (8%) |
4.97 ± 1.09 |
36. I'm confident I will not suffer a lost-time injury on my job here |
132 (4%) |
158 (5%) |
198 (7%) |
550 (18%) |
996 (33%) |
762 (25%) |
239 (8%) |
4.58 ± 1.36 |
37. Media attention has portrayed safety on the site accurately |
143 (10%) |
154 (11%) |
197 (14%) |
284 (20%) |
296 (21%) |
144 (10%) |
210 (15%) |
3.71 ± 1.54 |
Note – Only 1,428 (47%) workers responded to Q37, since Q37 was added to the survey in September, 2008.
Selected "Positive" Findings from Table 1-Worker Responses
- 89% of workers agree their foreman wants workers to inform him/her of any safety problems so they can get them fixed or reported to others
- 89% of workers agree they know their safety responsibilities at work
- 87% of workers agree they have received enough safety training to do their work safely
- 87% of workers agree they assist others to make sure they perform their work safely
- 86% of workers agree their foremen has the safety knowledge needed for the hazards faced on the job
- 86% of workers agree their foremen follows site safety rules and procedures closely
- 85% of workers agree that safety committees for the project would be beneficial
- 84% of workers agree they know who to report a hazard to when they see one on the job
- 84% of workers agree that other workers care about their safety and they care about theirs
- 82% of workers agree they always report safety hazards they see
Selected "Negative" Findings from Table 1 –Worker Responses
- 55% of workers agree that sometimes they can't do their job safety because other trades are in their way (39% disagree)
- 34% of workers disagree that Perini thinks that job site safety is more important than job schedules and deadlines (59% agree)
- 35% of workers disagree the media has portrayed safety on the site accurately (51% agree)
- 30% of workers agree their foremen thinks that productivity is more important than safety (62% disagree)
- 27% of workers disagree the GC thinks that job site safety is more important than job schedules and deadlines (69% agree)
- 25% of workers agree that sometimes they ignore a safety rule or policy in order to carry out an assignment or meet the schedule (65% disagree)
- 22% of workers agree they sometimes do not report a hazard because there isn't time to stop work or the work task is of short duration so they work around the hazard (73% disagree)
- 21% of workers agree that fatigue is an issue for them – they have caught themselves making mistakes on the job when they are tired (73% disagree)
- 17% of workers disagree that doing the work safely on the job has definite priority over getting it done on schedule (78% agree)
- 76% of workers agree they are confident they will not suffer a lost time injury on the job site (16% disagree)
1-1-c. Frequency Comparisons within the Worker Survey
1-1-c1. Comparisons between Perini and Subcontractor Workers
First, we examined the responses to the safety climate survey by comparing Perini workers (N=359) to all of the subcontractors' workers (N=2,527) on both City Center and Cosmopolitan sites combined. Overall, eighteen out of 37 questions (2, 3, 5, 6, 7, 9, 14, 15, 16, 17, 18, 19, 21, 23, 24, 32, 36, and 37) showed significant differences between Perini and subcontractor worker responses. Figures 8 through 11b represent selected questions for which there were significant differences between the two groups. Figure 8 shows a comparison of responses between Perini and all subcontractor workers to question number 2; the General Contractor (Perini) thinks that job site safety is more important than job schedules and deadlines. Over two-thirds of the subcontractor and Perini workers agreed that Perini prioritizes safety over schedules and deadlines. It is noteworthy that one-quarter of both Perini and subcontractor workers disagreed. Also, Perini workers strongly agree (21%) their employer (Perini) thinks job safety is more important than schedules and deadlines compared with subcontractor workers (14%).
Figure 8. Worker Responses to Q. 2: The General Contractor (Perini) thinks that job safety is more important than job schedules and deadlines

In response to Q.3 Perini safety personnel step in to stop unsafe operations, the distribution of responses was again significantly different between Perini workers and subcontractor workers as shown in (Figure 9). The majority of Perini workers (81%) agree with this statement compared with 76% percent of subcontractor workers.
Figure 9. Worker Responses to Q. 3: Perini safety personnel step in to stop unsafe operations

In response to Q. 8: My subcontractor's safety program works well together with Perini-it is clear to me who is responsible for what-Perini worker responses were significantly different from subcontractor workers (Figure 10). Three-quarters of Perini workers agreed with the statement (74%) whereas 68% of subcontractors agreed. Nearly a quarter of both Perini and subcontractor workers disagreed.
Figure 10. Worker Responses to Q. 7: Perini's safety program works well together with other subcontractor safety programs -- it is clear to me who is responsible for what

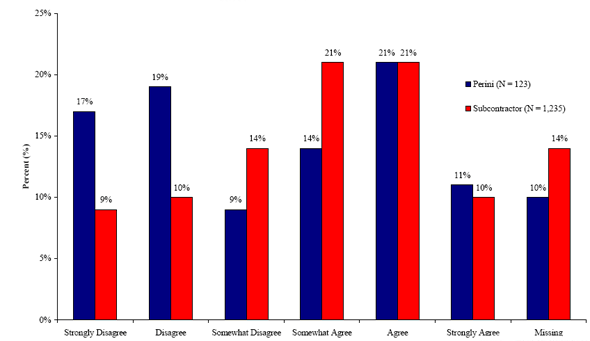
Figure 11a shows responses to question 32 asking whether workers thought toolbox talks about safety topics were given on a regular basis. Fewer Perini workers agreed (70%) than subcontractor workers (85%). Twenty-six percent of Perini workers disagreed compared with 8% of subcontractor workers. Figure 11b describes question 37 which addresses the accuracy of media attention on site safety. Forty-five percent of Perini workers disagreed that media attention was portrayed accurately compared with 33% of subcontractor workers.
Figure 11a. Worker Responses to Q. 32: Toolbox talks about safety are given regularly
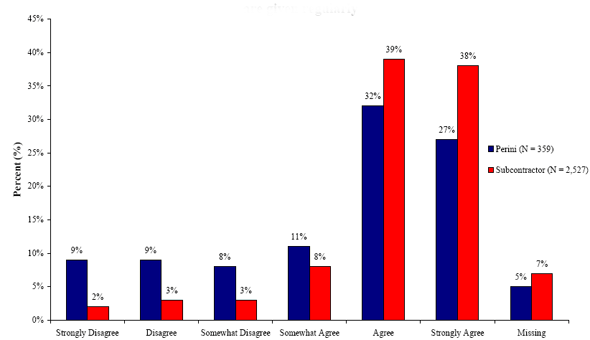
Figure 11b. Worker Responses to Q. 37: Media attention has portrayed safety on the site accurately
1-1-c2. Comparisons between City Center and Cosmopolitan Site Workers
Next, we compared responses from workers on the City Center site to those on the Cosmopolitan site. Figure 12 displays all the questions for which responses between workers at the two sites were significantly different. The distribution of percents of agreement is presented for these specific questions. Responses to questions one through nine focused on worker perceptions about Perini. Workers at the Cosmopolitan site tended to agree in significantly higher percentages than the City Center workers. For questions 8, 16, 20, and 28 workers at the Cosmopolitan site responded in significantly lower percentages than workers at the City Center site. It appears that for question 1-10 regarding questions about Perini, Cosmopolitan workers have a more favorable perception of Perini safety than City Center workers. Similarly, for questions 11-18, regarding perceptions about their employer (either Perini or subcontractor foremen) Cosmopolitan workers are more positive. In regard to questions about individuals' perceptions about their safety and safety on the site, questions 24, 25 and 32, workers at the Cosmopolitan site agreed they had more PPE than City Center workers, more training, and more regular tool box talks. On the other hand, for questions 20 and 28, regarding fatigue and ignoring safety rules and policy, workers at City Center agreed they experienced more fatigue and ignored more safety rules and policy than Cosmopolitan site workers.
Figure 12. Percent of Agreement (somewhat agree, agree and strongly agree) on climate survey questions between City Center and Cosmopolitan Workers

Survey questions included in Figure 12:-
Q2. The General Contractor (Perini) thinks that job site safety is more important than job schedules and deadlines
Q4. Perini thinks that safety is more important than productivity
Q6. Perini likes to get safety reports/feedback from workers like me
Q8. Perini believes that schedule is the most important issue on this project
Q15. My foreman thinks that safety is more important than productivity
Q16. My foreman thinks that productivity is more important than safety
Q18. My foreman stops work if working conditions are unsafe, even if we have a deadline
Q20. Fatigue is an issue for me – I have caught myself making mistakes on the job when I was tired
Q24. There is always enough personal protective equipment available to allow work to be done safely
Q25. I have received enough training to do my work safely
Q28. Sometimes I ignore a safety rule or policy in order to carry out an assignment to meet the schedule
Q32. Toolbox talks about safety are given regularly
1-1-c3. Comparisons based on Months Worked
The third set of descriptive analyses examined workers' perceptions of safety climate by experience on the job < three months and >= 3 months. Figure 13 compares perceptions about safety and scheduling/deadlines. This figure shows significant differences among workers employed >=3 months with those working less than three months. Those who were on the job <3 months perceived Perini to be focused more on safety than scheduling (74% agree) compared with those who worked greater than or equal to three months (67% agree).
Figure 13. Worker Responses to Q. 2: The General Contractor (Perini) thinks that job safety is more important than job schedules and deadlines

Figure 14 shows responses to question 6: Perini likes to get reports/feedback from workers like me. In this case, workers with more experience disagreed significantly more (36%) than those workers who had less experience (23%).
Figure 14. Worker Responses to Q. 6: Perini likes to get safety report / feedback from workers like me

1-2. Psychometric Analysis
1-2-a. Factors and Corresponding Survey Items for the Worker Survey
Based on a series of factor analyses, parallel analyses, and item analyses described above, 16 factors were identified for the worker survey. Factors and corresponding survey items, as well as descriptive statistics (alpha coefficients, possible range of scores, observed range of scores, mean, standard deviation, and number of respondents) of each factor are described in Tables 2. See Appendix 2 for definitions of the 16 factors.
Table 2. Factors and Corresponding Survey Items for the Worker Survey
Factors with corresponding survey items |
Alpha |
PR |
OR |
Mean |
SD |
N |
Perini Safety Climate |
.91 |
7-42 |
7-42 |
29.7 |
7.5 |
2817 |
Safety is visible on this job – for example, I have seen safety personnel or site supervisors or site management doing daily safety checks |
|
|
|
|
|
|
The General Contractor (Perini) thinks that job site safety is more important than job schedules and deadlines |
|
|
|
|
|
|
Perini safety personnel step in to stop unsafe operations |
|
|
|
|
|
|
Perini thinks that safety is more important than productivity |
|
|
|
|
|
|
The Perini safety staff follows up when there is a problem - it gets fixed right away and stays that way |
|
|
|
|
|
|
Perini likes to get safety reports/feedback from workers like me |
|
|
|
|
|
|
Perini cares for my safety on this job |
|
|
|
|
|
|
|
|
|
|
|
|
|
Foreman Safety Management |
.90 |
8-48 |
8-48 |
38.3 |
7.4 |
2843 |
Safety is important to the subcontractor I currently work for – he or she mentions it often when talking to crews on site |
|
|
|
|
|
|
My foreman has the safety knowledge needed for the hazards we face on this job |
|
|
|
|
|
|
My foreman makes sure we follow site safety rules and procedures very closely |
|
|
|
|
|
|
My foreman wants us to inform him/her of any safety problems so they can get them fixed or reported to others |
|
|
|
|
|
|
If my foreman is unsure of a safety question, he or she always calls in a safety specialist |
|
|
|
|
|
|
My foreman thinks that safety is more important than productivity |
|
|
|
|
|
|
My foreman thinks that productivity is more important than safety (reverse code) |
|
|
|
|
|
|
My foreman stops work if working conditions are unsafe, even if we have a deadline |
|
|
|
|
|
|
Factors with corresponding survey items |
Alpha |
PR |
OR |
Mean |
SD |
N |
Safety Behaviors |
.76 |
3-18 |
3-18 |
14.8 |
2.7 |
2741 |
I always report safety hazards that I see |
|
|
|
|
|
|
I know who to report a hazard to when I see one on the job |
|
|
|
|
|
|
I assist others to make sure they perform their work safely |
|
|
|
|
|
|
|
|
|
|
|
|
|
Safety Practices |
.79 |
5-30 |
5-30 |
24.5 |
4.3 |
2817 |
There is always enough personal protective equipment available to allow work to be done safely |
|
|
|
|
|
|
I have received enough training to do my work safely |
|
|
|
|
|
|
I always get enough site-specific information about a job to do it safely |
|
|
|
|
|
|
I know what my safety responsibilities are at work |
|
|
|
|
|
|
Toolbox talks about safety are given regularly |
|
|
|
|
|
|
|
|
|
|
|
|
|
Fatigue |
.67 |
2-12 |
2-12 |
4.5 |
2.4 |
2775 |
I work too many hours per week on this job |
|
|
|
|
|
|
Fatigue is an issue for me – I have caught myself making mistakes on the job when I was tired |
|
|
|
|
|
|
|
|
|
|
|
|
|
Unsafe work due to time pressure |
.67 |
2-12 |
2-12 |
5.0 |
2.6 |
2765 |
Sometimes I don't report a hazard because there isn't time to stop work or the work task is of too short a duration, so I work around the hazard |
|
|
|
|
|
|
Sometimes I ignore a safety rule or policy in order to carry out an assignment to meet the schedule |
|
|
|
|
|
|
|
|
|
|
|
|
|
Perini Safety Program |
N/A |
1-6 |
1-6 |
4.2 |
1.3 |
2808 |
Perini's safety program works well together with other subcontractor safety programs – it is clear to me who is responsible for what |
|
|
|
|
|
|
|
|
|
|
|
|
|
Subcontractor Safety Program |
N/A |
1-6 |
1-6 |
4.6 |
1.4 |
2783 |
My subcontractor's safety program works well together with other subcontractor's safety programs |
|
|
|
|
|
|
|
|
|
|
|
|
|
Importance of Scheduling |
N/A |
1-6 |
1-6 |
3.9 |
1.4 |
2785 |
Perini believes that schedule is the most important issue on this project |
|
|
|
|
|
|
Factors with corresponding survey items |
Alpha |
PR |
OR |
Mean |
SD |
N |
Safety Priority |
N/A |
1-6 |
1-6 |
4.6 |
1.4 |
2828 |
Doing the work safely on this job has definite priority over getting it done on schedule |
|
|
|
|
|
|
|
|
|
|
|
|
|
Situational Constraints Caused by Other Trades |
N/A |
1-6 |
1-6 |
3.7 |
1.6 |
2822 |
Sometimes I can't do my job safely because other trades are in my way |
|
|
|
|
|
|
|
|
|
|
|
|
|
Toolbox Talks Evaluation |
N/A |
1-6 |
1-6 |
4.9 |
1.1 |
2784 |
Toolbox talks are helpful to me |
|
|
|
|
|
|
|
|
|
|
|
|
|
Concern for Others |
N/A |
1-6 |
1-6 |
4.9 |
1.2 |
2798 |
Other workers care about my safety, and I care about theirs |
|
|
|
|
|
|
|
|
|
|
|
|
|
Perceived Need for Safety Committee |
N/A |
1-6 |
1-6 |
5.0 |
1.1 |
2796 |
I believe that safety committees for the project would be very beneficial |
|
|
|
|
|
|
|
|
|
|
|
|
|
Injury Risk Perception |
N/A |
1-6 |
1-6 |
2.4 |
1.4 |
2796 |
I'm confident I will not suffer a lost-time injury on my job here (reverse code) |
|
|
|
|
|
|
|
|
|
|
|
|
|
Media Coverage |
N/A |
1-6 |
1-6 |
3.7 |
1.6 |
1506 |
Media attention has portrayed safety on the site accurately |
|
|
|
|
|
|
Note. Alpha = alpha coefficient, which is computed only for Factors consisting of 2 or more items. It ranges from 0 to 1, with values closer to 1 indicating that the set of items measures well a single Factor. PR = possible range of scores. OR = observed range of scores. Mean = an arithmetic average of the sum of the individual responses to the set of items for each Factor based on the survey respondents. SD = standard deviation, which is a measure of how widely the respondents' scores differ from the mean score. The larger the standard deviation, the more spread are the respondents' scores. N = number of respondents who provide valid responses for each factor. N may differ across factors due to missing responses.
Summary of Table 2.
Overall, alpha coefficients ranged from 0.67 to 0.91, which were satisfactory. Both possible range of scores and observed range of scores were the same for all the factors, which indicated no or little evidence of range restriction.
1-2-b. Mean Comparisons within the Worker Survey
Mean comparisons of each of the 16 factors were then conducted based on the following background characteristics: (1) Perini compared with other subcontractors, (2) 10 trades (carpenter, electrician, laborer, plumber/pipefitter, sheet metal worker, operating engineer, insulator, cement mason, iron worker, and painter), (3) months worked on the job (less than 3- month vs. greater or equal to 3 months), (4) job site (City Center vs. Cosmopolitan), (5) work status (apprentice vs. journeymen), and (6) years worked in the construction industry (0-2, 2-5, 5-10, and 10 or more). Only statistically significant results are reported in Figures 15a – 17g.
1-2-b1. Mean Comparisons between Perini and Other Subcontractors
Figure 15a. Perini Safety Climate
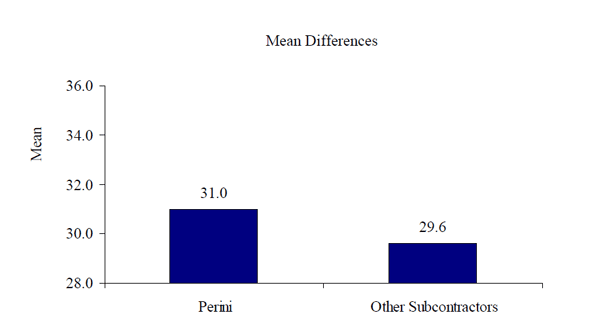
Figure 15b. Foreman Safety Management
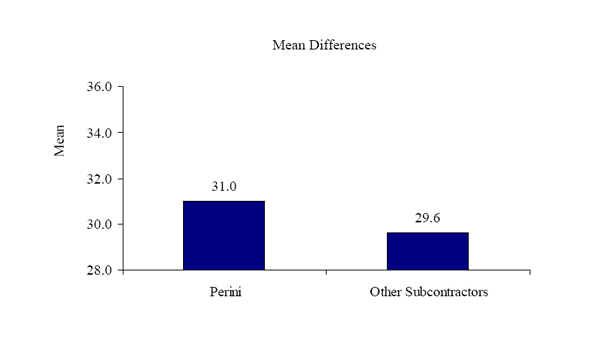
Figure 15c. Safety Practices
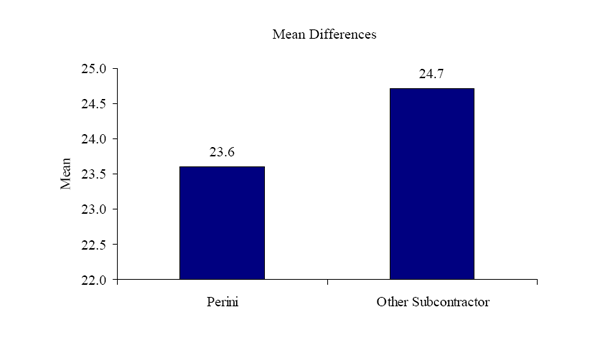
Figure 15d. Fatigue
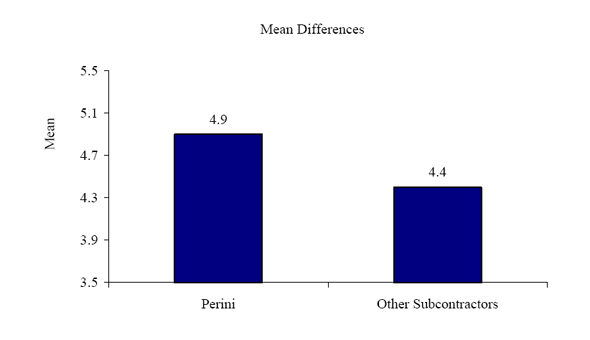
Figure 15e. Safety Priority
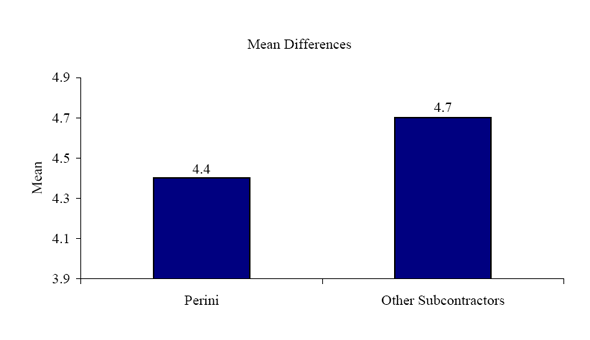
Figure 15f. Situational Constraints Caused by Other Trades
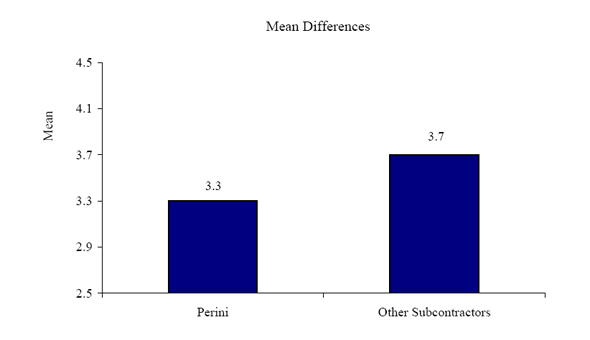
Figure 15g. Injury Risk Perception
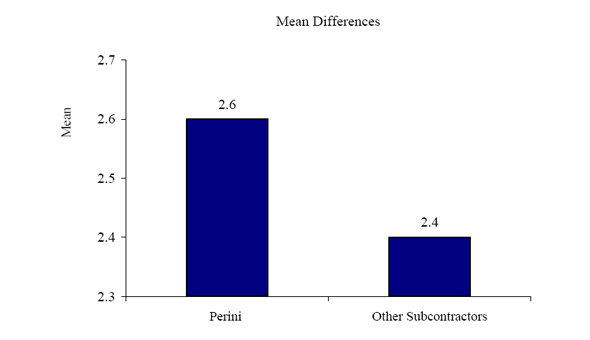
Figure 15h. Media Coverage
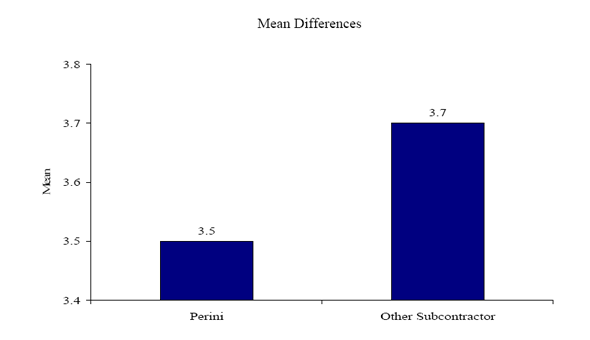
Figure 15i. Perini Safety Program
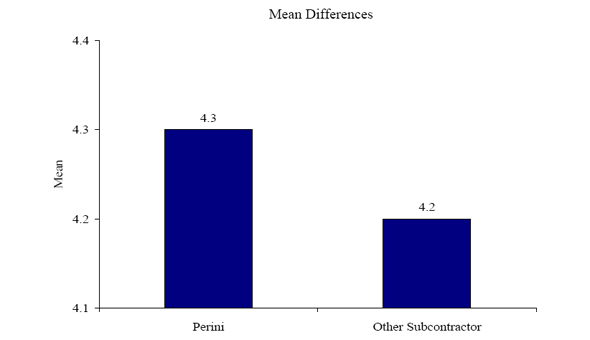
Figure 15j. Subcontractor Safety Program
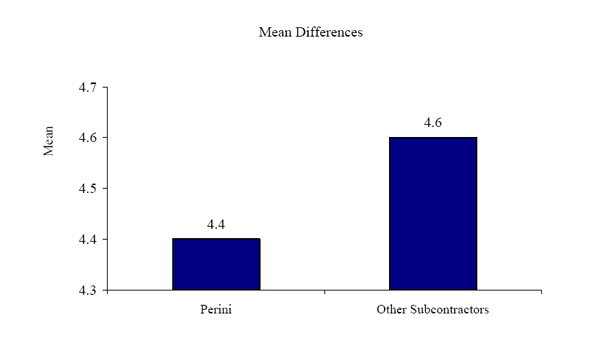
Summary of Key Findings Based on Comparisons Between Perini and Subcontractors (Figures 15a-15j).
In contrast to workers hired by subcontractors, workers hired by Perini
- reported more positive Perini safety climate.
- reported more positive Perini safety program (e.g., Perini's safety program works well together with other subcontractor safety programs).
- experienced less situational constraints caused by other trades.
- reported less positive foremen safety management (e.g., considering that safety is more important than productivity).
- reported less positive safety practices (e.g., having enough personal protective equipment, as well as receiving information and training about safety).
- reported less positive safety priority.
- perceived less accurate media coverage.
- experienced more fatigue at work.
- perceived a higher risk of being injured at work.
1-2-b2. Mean Comparisons based on Months Worked
Figure 16a. Perini Safety Climate
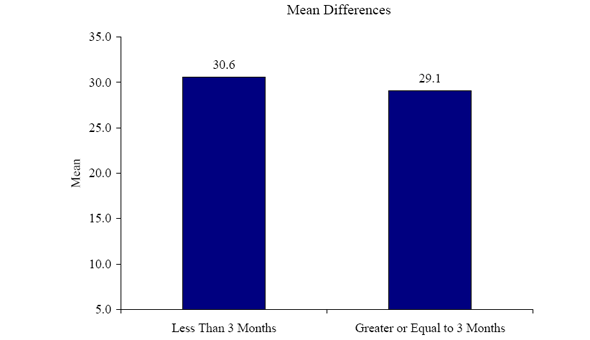
Figure 16b. Perini Safety Program
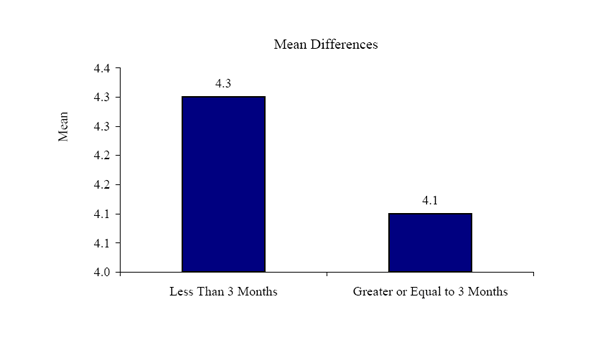
Figure 16c. Subcontractor Safety Program
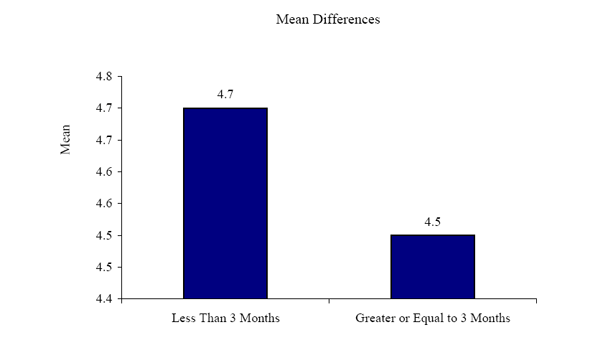
Figure 16d. Safety Practices
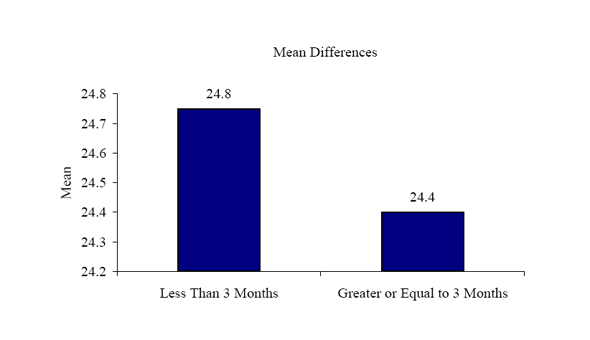
Figure 16e. Importance of Scheduling
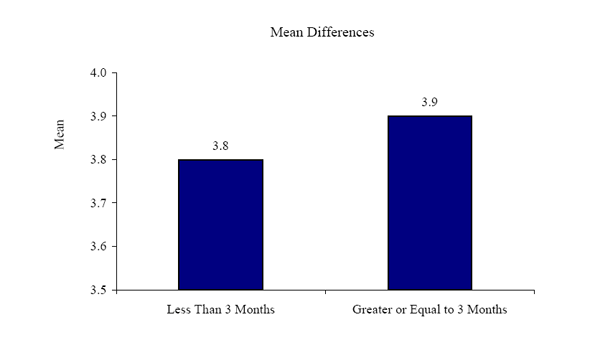
Figure 16f. Situational Constraints Caused by Other Trades
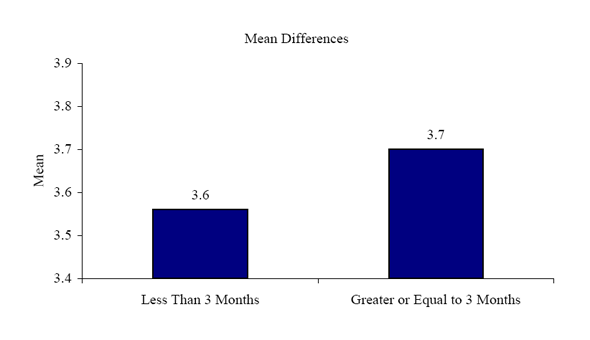
Figure 16g. Injury Risk Perception
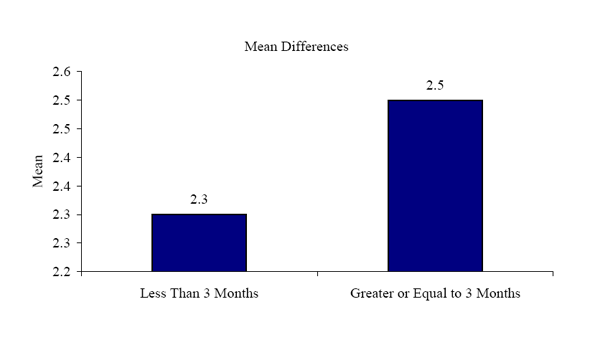
Summary of Key Findings Based on Comparisons Between Those Who Worked < than 3 Months vs. Those Who Worked >=3 Months (Figures 16a-16g).
Workers who have been working on the job site for 3 months or longer, compared to workers who have been working on the job site for less than 3 months
- reported more positive Perini safety climate.
- reported more positive Perini safety program.
- reported more positive subcontractor safety program (e.g., s subcontractor's safety program works well together with other subcontractor's safety programs).
- reported more positive safety practices.
- experienced less situational constraints caused by other trades.
- perceived less risk of being injured at work.
These results may indirectly suggest some improvements on safety since May/June/July 2008. It should be noted that the worker surveys were distributed beginning in July 2008 and administered throughout the course of training through October 2008.
1-2-b3. Mean Comparisons based on Job Site (City Center vs. Cosmopolitan)
Figure 17a. Foreman Safety Management
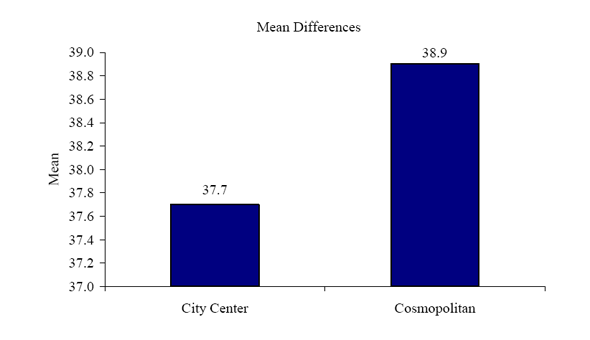
Figure 17b. Safety Behaviors
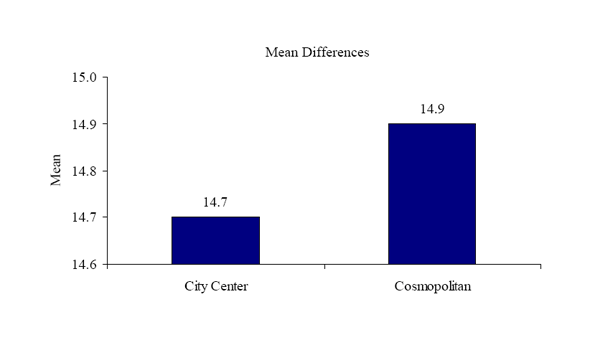
Figure 17c. Safety Practices
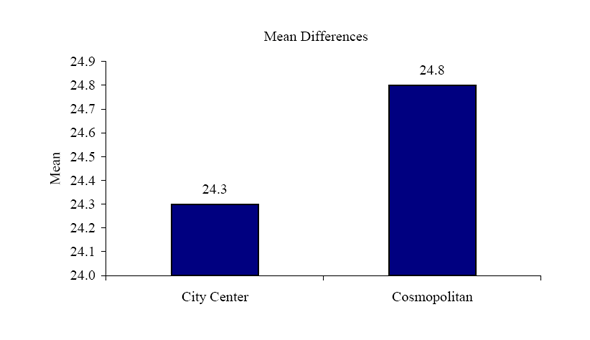
Figure 17d. Fatigue
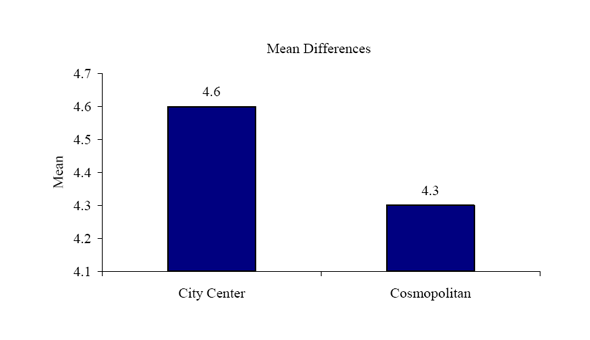
Figure 17e. Unsafe Work due to Time Pressure
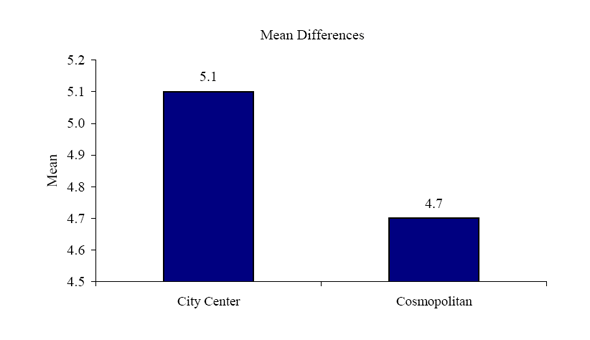
Figure 17f. Situational Constraints Caused by Other Trades
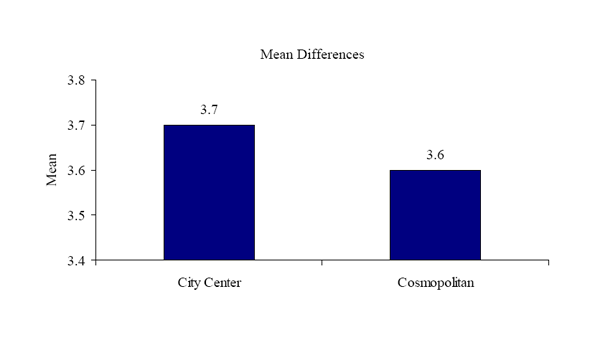
Figure 17g. Importance of Scheduling
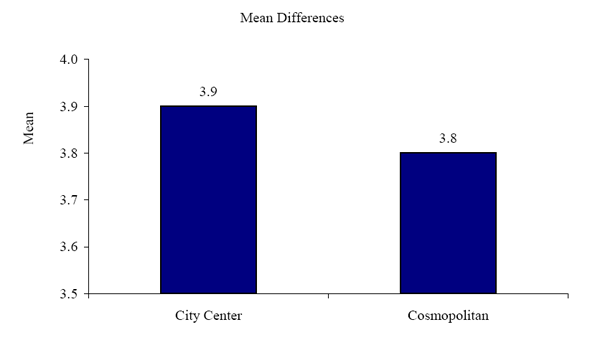
Summary of Key Findings Based on Comparisons Between City Center and Cosmopolitan (Figures 17a-17g).
Compared to workers in City Center, workers in Cosmopolitan
- reported more positive foreman safety management.
- reported more positive safety behaviors.
- reported more positive safety practices.
- engaged less in unsafe work due to time pressure.
- experienced less fatigue.
- experienced less situational constraints caused by other trades.


