
Workplace Safety Climate Surveys for City Center and Cosmopolitan Construction Projects, Las Vegas, Nevada (Final Report)
-
Las Vegas Projects - Assessment and Audit
The following are links to all of the items in this collection:
Documents
- Fall Hazard Identification and Control Audit of the Aria Building, City Center Project, Las Vegas Nevada
- Fall Hazard Identification and Control Audit of the Mandarin Building, City Center Project, Las Vegas Nevada
- Worksite Assessment Team Site Visit Report for City Center and Cosmopolitan Construction Projects, Las Vegas Nevada
- Workplace Safety Climate Surveys for City Center and Cosmopolitan Construction Projects, Las Vegas, Nevada (Final Report)
Summary Statement
The worksite assessment was conducted in response to work-related fatalities. The primary purpose of the visit was to better understand safety management and programs used by general contractor at both the City Center and Cosmopolitan construction projects and to provide constructive feedback to improve safety and health on these projects. During the site visit, an average of 7,200 employees (day shift) in multiple crafts worked at the site. Part of a collection. Click on the 'collection' button to access the other items.
January 2009
Acknowledgments
Detailed contents of the Final Report
A. Introduction
B. Methods
C. Results
Appendices
References
5. Comparison of 4 groups
5-1. Descriptive Analysis
5-1-a. Item-Specific Responses
Next, we examined differences in perception/attitude regarding the safety climate by comparing safety climate survey responses among the workers, foremen, superintendents and top management executives. Table 9 below shows the item specific responses to the safety climate survey questions asked of all groups. Responses that were statistically significantly different between the 4 groups are indicated in dark gray and gray. If there were significant differences across multiple groups then black was introduced to make it visually clear. For example, for question #1, worker responses were significantly different from foremen, superintendents and top management executives (hereafter referred to as executives). In question #5, not only were worker responses significantly different from foremen, superintendents, and executives, but executives responses were significantly different from foremen, and superintendents as well as workers. Overall, there were significant differences among the 4 groups (workers, foremen, superintendent and executives) for 16 of the 24 comparable questions on the safety climate survey. Table 9 shows the responses for each category of the 6 point likert scale for each of the climate survey questions. Selected highlights are presented at the end of Table 9.
Table 9. Comparison of Item-Specific Responses to Safety Climate Survey Questions across the 4 groups – Workers, Foremen, Superintendents, Executives
Questions |
Strongly Disagree |
Disagree |
Somewhat Disagree |
Somewhat Agree |
Agree |
Strongly Agree |
Missing |
Mean |
Safety is visible on this job – for example, I have seen safety personnel or site supervisors or site management doing daily safety checks. |
|
|
|
|
|
|
|
|
Construction Workers |
108 (4%) |
163 (5%) |
200 (7%) |
578 (19%) |
1,271 (42%) |
575 (19%) |
140 (5%) |
4.54 ± 1.25 |
Foremen |
0 (0%) |
1 (1%) |
3 (2%) |
9 (7%) |
59 (44%) |
61 (46%) |
1 (1%) |
5.32 ± 0.76 |
Superintendents |
0 (0%) |
0 (0%) |
0 (0%) |
4 (7%) |
18 (30%) |
38 (62%) |
1 (2%) |
5.57 ± 0.62 |
Executives |
0 (0%) |
0 (0%) |
0 (0%) |
0 (0%) |
5 (29%) |
11 (65%) |
1 (6%) |
5.69 ± 0.48 |
The General Contractor (Perini) thinks that job site safety is more important than job schedules and deadlines. |
|
|
|
|
|
|
|
|
Construction Workers |
202 (7%) |
268 (9%) |
338 (11%) |
728 (24%) |
902 (30%) |
450 (15%) |
147 (5%) |
4.11 ± 1.43 |
Foremen |
0 (0%) |
4 (3%) |
3 (2%) |
13 (10%) |
58 (43%) |
55 (41%) |
1 (1%) |
5.18 ± 0.92 |
Superintendents |
0 (0%) |
0 (0%) |
0 (0%) |
4 (7%) |
24 (39%) |
31 (51%) |
2 (3%) |
5.46 ± 0.62 |
Executives |
0 (0%) |
1 (6%) |
0 (0%) |
1 (6%) |
5 (29%) |
10 (59%) |
0 (0%) |
5.35 ± 1.06 |
Perini safety personnel step in to stop unsafe operations. |
|
|
|
|
|
|
|
|
Construction Workers |
122 (4%) |
203 (7%) |
253 (8%) |
683 (23%) |
1,118 (37%) |
486 (16%) |
170 (6%) |
4.37 ± 1.30 |
Foremen |
1 (1%) |
4 (3%) |
2 (1%) |
9 (7%) |
50 (37%) |
67 (50%) |
1 (1%) |
5.29 ± 0.97 |
Superintendents |
1 (2%) |
0 (0%) |
1 (2%) |
0 (0%) |
23 (38%) |
34 (56%) |
2 (3%) |
5.47 ± 0.84 |
Executives |
0 (0%) |
0 (0%) |
0 (0%) |
1 (6%) |
8 (47%) |
7 (41%) |
1 (6%) |
5.38 ± 0.62 |
The Perini safety staff follows up when there is a problem - it gets fixed right away and stays that way. |
|
|
|
|
|
|
|
|
Construction Workers |
146 (5%) |
212 (7%) |
344 (11%) |
912 (30%) |
867 (29%) |
348 (11%) |
206 (7%) |
4.13 ± 1.29 |
Foremen |
1 (1%) |
1 (1%) |
6 (4%) |
19 (14%) |
61 (46%) |
45 (34%) |
1 (1%) |
5.05 ± 0.92 |
Superintendents |
1 (2%) |
0 (0%) |
2 (3%) |
3 (5%) |
25 (41%) |
29 (48%) |
1 (2%) |
5.30 ± 0.93 |
Executives |
0 (0%) |
0 (0%) |
0 (0%) |
0 (0%) |
6 (35%) |
10 (59%) |
1 (6%) |
5.63 ± 0.50 |
 Perini's safety program works well together with other subcontractor safety programs – it is clear to me who is responsible for what. |
|
|
|
|
|
|
|
|
Construction Workers |
147 (5%) |
249 (8%) |
329 (11%) |
738 (24%) |
965 (32%) |
380 (13%) |
227 (7%) |
4.16 ± 1.34 |
Foremen |
2 (1%) |
5 (4%) |
6 (4%) |
21 (16%) |
63 (47%) |
37 (28%) |
0 (0%) |
4.86 ± 1.09 |
Superintendents |
1 (2%) |
0 (0%) |
2 (3%) |
8 (13%) |
28 (46%) |
20 (33%) |
2 (3%) |
5.07 ± 0.94 |
Executives |
0 (0%) |
0 (0%) |
0 (0%) |
4 (24%) |
8 (47%) |
4 (24%) |
1 (6%) |
5.00 ± 0.73 |
My subcontractor's safety program works well together with other subcontractor's safety programs |
|
|
|
|
|
|
|
|
Construction Workers |
68 (2%) |
119 (4%) |
175 (6%) |
700 (23%) |
1,215 (40%) |
506 (17%) |
252 (8%) |
4.58 ± 1.13 |
Foremen |
0 (0%) |
11 (8%) |
9 (7%) |
13 (10%) |
66 (49%) |
29 (22%) |
6 (4%) |
4.73 ± 1.15 |
Superintendents |
0 (0%) |
0 (0%) |
2 (3%) |
7 (11%) |
27 (44%) |
24 (39%) |
1 (2%) |
5.22 ± 0.78 |
Executives |
N/A |
N/A |
N/A |
N/A |
N/A |
N/A |
N/A |
N/A |
 Safety is important to Perini / my subcontractor – he or she mentions it often when talking to crews on site. |
|
|
|
|
|
|
|
|
Construction Workers |
72 (2%) |
108 (4%) |
146 (5%) |
520 (17%) |
1,159 (38%) |
834 (27%) |
196 (6%) |
4.79 ± 1.18 |
Foremen |
0 (0%) |
1 (1%) |
1 (1%) |
5 (4%) |
68 (51%) |
59 (44%) |
0 (0%) |
5.37 ± 0.67 |
Superintendents |
0 (0%) |
0 (0%) |
0 (0%) |
0 (0%) |
23 (38%) |
37 (61%) |
1 (2%) |
5.62 ± 0.49 |
Executives |
N/A |
N/A |
N/A |
N/A |
N/A |
N/A |
N/A |
N/A |
 My foreman has the safety knowledge needed for the hazards we face on this job. |
|
|
|
|
|
|
|
|
Construction Workers |
N/A |
N/A |
N/A |
N/A |
N/A |
N/A |
N/A |
N/A |
Foremen |
1 (1%) |
2 (1%) |
0 (0%) |
4 (3%) |
66 (49%) |
61 (46%) |
0 (0%) |
5.35 ± 0.79 |
Superintendents |
0 (0%) |
0 (0%) |
1 (2%) |
7 (11%) |
22 (36%) |
30 (49%) |
1 (2%) |
5.35 ± 0.76 |
Executives |
N/A |
N/A |
N/A |
N/A |
N/A |
N/A |
N/A |
N/A |
My foreman makes sure we follow site safety rules and procedures very closely. |
|
|
|
|
|
|
|
|
Construction Workers |
N/A |
N/A |
N/A |
N/A |
N/A |
N/A |
N/A |
N/A |
Foremen |
1 (1%) |
1 (1%) |
0 (0%) |
6 (4%) |
62 (46%) |
63 (47%) |
1 (1%) |
5.38 ± 0.75 |
Superintendents |
0 (0%) |
0 (0%) |
0 (0%) |
3 (5%) |
21 (34%) |
36 (59%) |
1 (2%) |
5.55 ± 0.59 |
Executives |
N/A |
N/A |
N/A |
N/A |
N/A |
N/A |
N/A |
N/A |
 My foreman thinks that safety is more important than productivity. |
|
|
|
|
|
|
|
|
Construction Workers |
N/A |
N/A |
N/A |
N/A |
N/A |
N/A |
N/A |
N/A |
Foremen |
2 (1%) |
4 (3%) |
4 (3%) |
13 (10%) |
61 (46%) |
44 (33%) |
6 (4%) |
5.02 ± 1.05 |
Superintendents |
0 (0%) |
0 (0%) |
3 (5%) |
6 (10%) |
19 (31%) |
31 (51%) |
2 (3%) |
5.32 ± 0.86 |
Executives |
N/A |
N/A |
N/A |
N/A |
N/A |
N/A |
N/A |
N/A |
Fatigue is an issue for me – I have caught myself making mistakes on the job when I was tired. |
|
|
|
|
|
|
|
|
Construction Workers |
951 (31%) |
999 (33%) |
266 (9%) |
266 (9%) |
234 (8%) |
117 (4%) |
202 (7%) |
2.36 ± 1.44 |
Foremen |
36 (27%) |
60 (45%) |
9 (7%) |
13 (10%) |
6 (4%) |
1 (1%) |
9 (7%) |
2.17 ± 1.15 |
| Superintendents | 8 (13%) 1 | 17 (28%) | 5 (8%) | 15 (25%) | 0 (0%) | 0 (0%) | 4 (7%) | 3.11 ± 1.41 |
Executives |
(6%) |
3 (18%) |
5 (29%) |
4 (24%) |
4 (24%) |
0 (0%) |
0 (0%) |
3.41 ± 1.23 |
Doing the work safely on this job has definite priority over getting it done on schedule. |
|
|
|
|
|
|
|
|
Construction Workers |
129 (4%) |
164 (5%) |
232 (8%) |
454 (15%) |
984 (32%) |
865 (29%) |
207 (7%) |
4.62 ± 1.38 |
Foremen |
5 (4%) |
10 (7%) |
7 (5%) |
14 (10%) |
62 (46%) |
30 (22%) |
6 (4%) |
4.63 ± 1.33 |
Superintendents |
0 (0%) |
3 (5%) |
1 (2%) |
10 (16%) |
22 (36%) |
24 (39%) |
1 (2%) |
5.05 ± 1.05 |
Executives |
0 (0%) |
0 (0%) |
0 (0%) |
3 (18%) |
8 (47%) |
6 (35%) |
0 (0%) |
5.18 ± 0.73 |
 Sometimes I can't do my job safely because other trades are in my way. |
|
|
|
|
|
|
|
|
Construction Workers |
346 (11%) |
573 (19%) |
260 (9%) |
564 (19%) |
684 (23%) |
395 (13%) |
213 (7%) |
3.66 ± 1.64 |
Foremen |
31 (23%) |
43 (32%) |
10 (7%) |
18 (13%) |
14 (10%) |
10 (7%) |
8 (6%) |
2.77 ± 1.61 |
Superintendents |
16 (26%) |
20 (33%) |
6 (10%) |
4 (7%) |
9 (15%) ) |
4 (7%) |
2 (3%) |
2.69 ± 1.63 |
| Executives | 4 (24%) | 7 (41%) | 0 (0%) | 1 (6%) | 4 (24%) | 0 (0%) | 1 (6%) | 2.63 ± 1.59 |
 There is always enough personal protective equipment available to allow work to be done safely. |
|
|
|
|
|
|
|
|
Construction Workers |
135 (4%) |
169 (6%) |
195 (6%) |
415 (14%) |
1,163 (38%) |
756 (25%) |
202 (7%) |
4.61 ± 1.36 |
Foremen |
3 (2%) |
3 (2%) |
6 (4%) |
7 (5%) |
59 (44%) |
51 (38%) |
5 (4%) |
5.09 ± 1.10 |
| Superintendents | 1 (2%)< | 0 (0%) | 3 (5%) | 2 (3%) | 24 (39%) | 30 (49%) | 1 (2%) | 5.30 ± 0.96 |
Executives |
0 (0%) |
0 (0%) |
0 (0%) |
3 (18%) |
4 (24%) |
9 (53%) |
1 (6%) |
5.38 ± 0.81 |
I have received enough training to do my work safely. |
|
|
|
|
|
|
|
|
Construction Workers |
49 (2%) |
71 (2%) |
99 (3%) |
306 (10%) |
1,305 (43%) |
1,024 (34%) |
181 (6%) |
5.04 ± 1.05 |
Foremen |
1 (1%) |
2 (1%) |
6 (4%) |
16 (12%) |
64 (48%) |
40 (30%) |
5 (4%) |
5.02 ± 0.94 |
Superintendents |
1 (2%) |
1 (2%) |
1 (2%) |
5 (8%) |
39 (64%) |
12 (20%) |
2 (3%) |
4.97 ± 0.89 |
Executives |
0 (0%) |
0 (0%) |
2 (12%) |
3 (18%) |
8 (47%) |
3 (18%) |
1 (6%) |
4.75 ± 0.93 |
 I know what my safety responsibilities are at work. |
|
|
|
|
|
|
|
|
Construction Workers |
35 (1%) |
33 (1%) |
51 (2%) |
231 (8%) |
1,304 (43%) |
1,157 (38%) |
224 (7%) |
5.21 ± 0.91 |
Foremen |
0 (0%) |
1 (1%) |
1 (1%) |
8 (6%) |
72 (54%) |
47 (35%) |
5 (4%) |
5.26 ± 0.68 |
| Superintendents | 0 (0%) | 2 (3%) | 0 (0%) | 5 (8%) | 29 (48%) | 24 (39%) | 1 (2%) | 5.22 ± 0.87 |
Executives |
0 (0%) |
0 (0%) |
1 (6%) |
4 (24%) |
10 (59%) |
2 (12%) |
0 (0%) |
4.76 ± 0.75 |
Sometimes I ignore a safety rule or policy in order to carry out an assignment to meet the schedule. |
|
|
|
|
|
|
|
|
Construction Workers |
863 (28%) |
853 (28%) |
284 (9%) |
345 (11%) |
338 (11%) |
119 (4%) |
233 (8%) |
2.57 ± 1.53 |
Foremen |
N/A |
N/A |
N/A |
N/A |
N/A |
N/A |
N/A |
N/A |
Superintendents |
31 (51%) |
20 (33%) |
3 (5%) |
0 (0%) |
3 (5%) |
1 (2%) |
3 (5%) |
1.74 ± 1.13 |
Executives |
5 (29%) |
10 (59%) |
0 (0%) |
1 (6%) |
0 (0%) |
1 (6%) |
0 (0%) |
2.06 ± 1.25 |
 I always report safety hazards that I see. |
|
|
|
|
|
|
|
|
Construction Workers |
80 (3%) |
122 (4%) |
162 (5%) |
447 (15%) |
1,203 (40%) |
815 (27%) |
206 (7%) |
4.77 ± 1.21 |
Foremen |
2 (1%) |
2 (1%) |
11 (8%) |
22 (16%) |
58 (43%) |
34 (25%) |
5 (4%) |
4.81 ± 1.07 |
Superintendents |
0 (0%) |
2 (3%) |
3 (5%) |
19 (31%) |
24 (39%) |
11 (18%) |
2 (3%) |
4.66 ± 0.96 |
Executives |
0 (0%) |
0 (0%) |
5 (29%) |
5 (29%) |
5 (29%) |
2 (12%) |
0 (0%) |
4.24 ± 1.03 |
I know who to report a hazard to when I see one on the job. |
|
|
|
|
|
|
|
|
Construction Workers |
67 (2%) |
69 (2%) |
77 (3%) |
230 (8%) |
1,349 (44%) |
1,021 (34%) |
222 (7%) |
5.06 ± 1.07 |
Foremen |
0 (0%) |
1 (1%) |
0 (0%) |
15 (11%) |
65 (49%) |
48 (36%) |
5 (4%) |
5.23 ± 0.71 |
Superintendents |
0 (0%) |
1 (2%) |
0 (0%) |
7 (11%) |
28 (46%) |
23 (38%) |
2 (3%) |
5.22 ± 0.79 |
Executives |
0 (0%) |
0 (0%) |
0 (0%) |
4 (24%) |
8 (47%) |
5 (29%) |
0 (0%) |
5.06 ± 0.75 |
 I assist others to make sure they perform their work safely. |
|
|
|
|
|
|
|
|
Construction Workers |
49 (2%) |
55 (2%) |
72 (2%) |
426 (14%) |
1,358 (45%) |
845 (28%) |
230 (8%) |
4.97 ± 1.01 |
Foremen |
0 (0%) |
2 (1%) |
1 (1%) |
13 (10%) |
75 (56%) |
38 (28%) |
5 (4%) |
5.13 ± 0.74 |
Superintendents |
0 (0%) |
1 (2%) |
1 (2%) |
14 (23%) |
30 (49%) |
13 (21%) |
2 (3%) |
4.90 ± 0.82 |
Executives |
0 (0%) |
0 (0%) |
0 (0%) |
7 (41%) |
7 (41%) |
2 (12%) |
1 (6%) |
4.69 ± 0.70 |
 Toolbox talks about safety are given regularly. |
|
|
|
|
|
|
|
|
Construction Workers |
105 (3%) |
106 (3%) |
104 (3%) |
249 (8%) |
1,146 (38%) |
1,086 (36%) |
239 (8%) |
4.96 ± 1.25 |
Foremen |
0 (0%) |
2 (1%) |
1 (1%) |
7 (5%) |
60 (45%) |
59 (44%) |
5 (4%) |
5.34 ± 0.76 |
Superintendents |
0 (0%) |
0 (0%) |
2 (3%) |
2 (3%) |
23 (38%) |
32 (52%) |
2 (3%) |
5.44 ± 0.73 |
Executives |
0 (0%) |
0 (0%) |
0 (0%) |
0 (0%) |
7 (41%) |
9 (53%) |
1 (6%) |
5.56 ± 0.51 |
 Toolbox talks are helpful to me. |
|
|
|
|
|
|
|
|
Construction Workers |
68 (2%) |
85 (3%) |
127 (4%) |
438 (14%) |
1,168 (38%) |
898 (30%) |
251 (8%) |
4.88 ± 1.15 |
Foremen |
0 (0%) |
2 (1%) |
1 (1%) |
10 (7%) |
60 (45%) |
56 (42%) |
5 (4%) |
5.29 ± 0.77 |
Superintendents |
0 (0%) |
0 (0%) |
1 (2%) |
6 (10%) |
27 (44%) |
25 (41%) |
2 (3%) |
5.29 ± 0.72 |
Executives |
0 (0%) |
0 (0%) |
0 (0%) |
1 (6%) |
10 (59%) |
5 (29%) |
1 (6%) |
5.25 ± 0.58 |
 I believe that safety committees for the project would be very beneficial. |
|
|
|
|
|
|
|
|
Construction Workers |
55 (2%) |
68 (2%) |
94 (3%) |
473 (16%) |
1,104 (36%) |
1,002 (33%) |
239 (8%) |
4.97 ± 1.09 |
Foremen |
1 (1%) |
2 (1%) |
5 (4%) |
25 (19%) |
47 (35%) |
48 (36%) |
6 (4%) |
5.02 ± 1.00 |
Superintendents |
1 (2%) |
1 (2%) |
2 (3%) |
9 (15%) |
31 (51%) |
15 (25%) |
2 (3%) |
4.92 ± 0.99 |
Executives |
0 (0%) |
0 (0%) |
0 (0%) |
3 (18%) |
9 (53%) |
5 (29%) |
0 (0%) |
5.12 ± 0.70 |
 Media attention has portrayed safety on the site accurately |
|
|
|
|
|
|
|
|
Construction Workers |
143 (10%) |
154 (11%) |
197 (14%) |
284 (20%) |
296 (21%) |
144 (10%) |
210 (15%) |
3.71 ± 1.54 |
Foremen |
47 (35%) |
26 (19%) |
14 (10%) |
8 (6%) |
22 (16%) |
9 (7%) |
8 (6%) |
2.67 ± 1.74 |
Superintendents |
36 (59%) |
11 (18%) |
3 (5%) |
2 (3%) |
5 (8%) |
3 (5%) |
1 (2%) |
1.97 ± 1.54 |
Executives |
9 (53%) |
5 (29%) |
1 (6%) |
0 (0%) |
1 (6%) |
1 (6%) |
0 (0%) |
1.94 ± 1.48 |
Note: Refer to Appendix 1-5 for mapping of question numbers corresponding to each of the 4 survey groups.
Selected highlights showing significant differences comparing responses across the 4 groups (workers, foremen, superintendents, and top management executives)- 80% of the workers compared with 97% foremen, 99% superintendents, and 94% executives agree that safety is visible on the job or site management is doing daily safety check
- 69% of the workers compared with 94% foremen, 97% superintendents, and 94% executives agree that Perini thinks that job site safety is more important than job schedules and deadlines
- 76% of the workers compared with 94% foremen, 94% superintendents and executives agree that Perini safety personnel step in to stop unsafe operations
- 70% of the workers compared with 94% foremen, superintendents, and executives agree that Perini safety staff follows up when there is a problem- it gets fixed right away and stays that way
- 82% of the workers compared with 99% of foremen, superintendents agree that safety is important to Perini/my subcontractor-he or she mentions it often when talking to crews on site
- 51% of the workers compared with 29% foremen, 16% superintendents, and 13% executives agree that the media portrayed safety on the site accurately
5-2. Psychometric Analysis
5-2-a. Mean Comparisons between the Four Surveys (i.e., Responses from Four Organizational Levels)
To compare underlying themes or factors between the four surveys (i.e., different organizational levels: workers, foremen, superintendents, or executives), the following steps were followed. First, common survey items among two or more of the four surveys were matched. Second, the correspondent factors of the above common items were identified. Thus, the number of items associated with the correspondent factor are either the same or smaller.
5-2-a1. Mean Comparisons between Workers, Foremen, Superintendents, and Executives
Eight factors were compared between the four organizational levels. These factors were (1) Perini safety climate, (2) Perini safety program, (3) fatigue, (4) safety practices, (5) safety priority, (6) situational constraints caused by other trades, (7) toolbox talks evaluation, and (8) accuracy of media coverage. Only statistically significant results are reported in Figures 33a – 33h.
Figure 33a. Perini Safety Climate
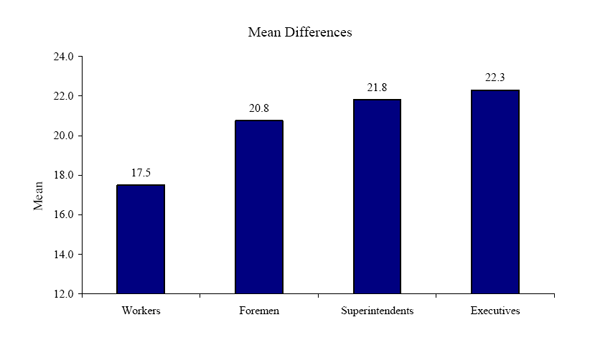
| Organizational Level | Mean | Workers | Foremen | Superintendents | Executives |
| Workers | 17.5 | ||||
| Foremen | 20.8 | x | |||
| Superintendents | 21.8 | x | |||
| Executives | 22.3 | x |
Note: An "x" indicates two groups are significantly different from each other.
Figure 33b. Perini Safety Program
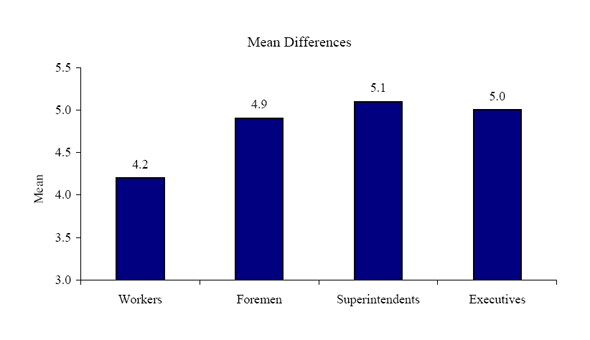
| Organizational Level | Mean | Workers | Foremen | Superintendents | Executives |
| Workers | 4.2 | ||||
| Foremen | 4.9 | x | |||
| Superintendents | 5.1 | x | |||
| Executives | 5.0 |
Note: An "x" indicates two groups are significantly different from each other.
Figure 33c. Fatigue
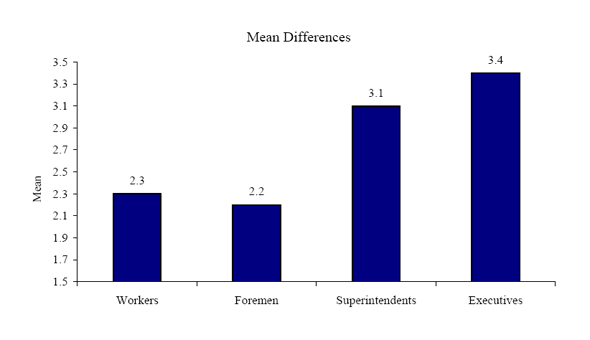
| Organizational Level | Mean | Workers | Foremen | Superintendents | Executives |
| Workers | 2.3 | ||||
| Foremen | 2.2 | ||||
| Superintendents | 3.1 | x | x | ||
| Executives | 3.4 | x | x |
Note: An "x" indicates two groups are significantly different from each other.
Figure 33d. Safety Practices
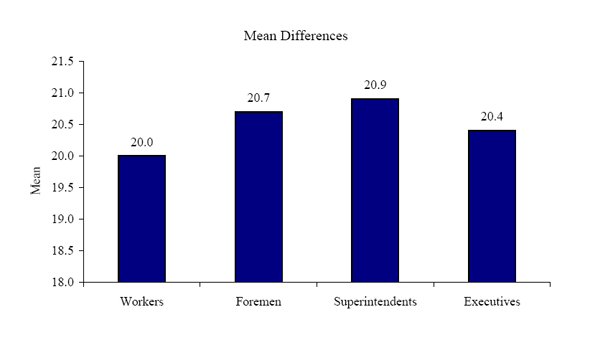
| Organizational Level | Mean | Workers | Foremen | Superintendents | Executives |
| Workers | 20.0 | ||||
| Foremen | 20.7 | x | |||
| Superintendents | 20.9 | ||||
| Executives | 20.4 |
Note: An "x" indicates two groups are significantly different from each other.
Figure 33e. Safety Priority
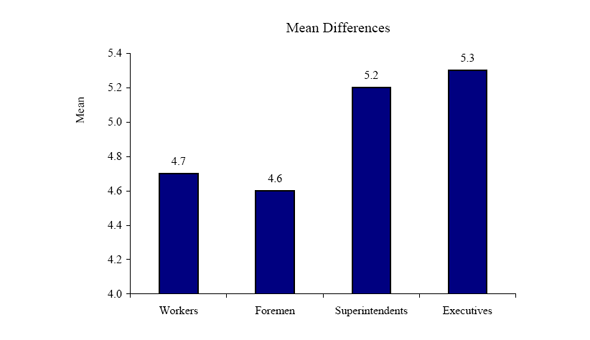
| Organizational Level | Mean | Workers | Foremen | Superintendents | Executives |
| Workers | 4.7 | ||||
| Foremen | 4.6 | ||||
| Superintendents | 5.2 | x | x | ||
| Executives | 5.3 |
Note: An "x" indicates two groups are significantly different from each other.
Figure 33f. Situational Constraints Caused by Other Trades
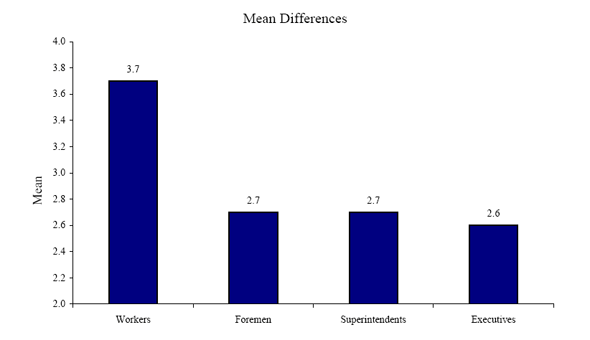
| Organizational Level | Mean | Workers | Foremen | Superintendents | Executives |
| Workers | 3.7 | ||||
| Foremen | 2.7 | x | |||
| Superintendents | 2.7 | x | |||
| Executives | 2.6 |
Note: An "x" indicates two groups are significantly different from each other.
Figure 33g. Toolbox Talks Evaluation
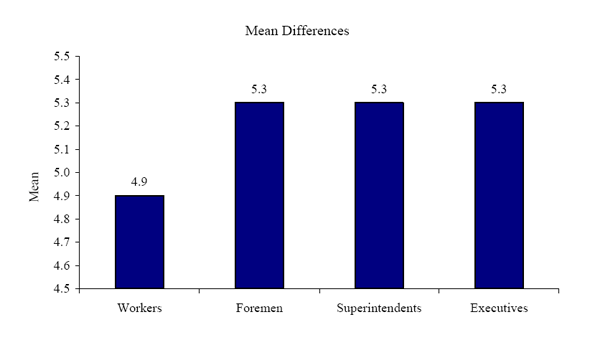
| Organizational Level | Mean | Workers | Foremen | Superintendents | Executives |
| Workers | 4.9 | ||||
| Foremen | 5.3 | x | |||
| Superintendents | 5.3 | x | |||
| Executives | 5.3 |
Note: An "x" indicates two groups are significantly different from each other.
Figure 33h. Media Coverage
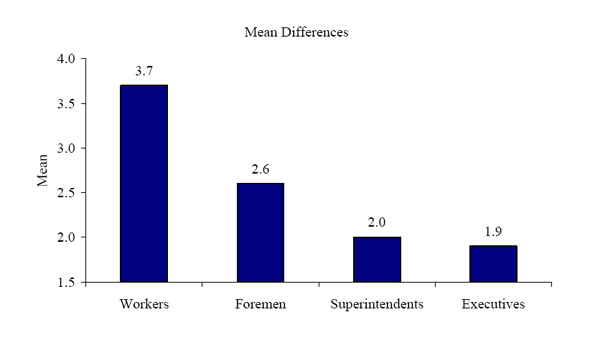
| Organizational Level | Mean | Workers | Foremen | Superintendents | Executives |
| Workers | 3.7 | ||||
| Foremen | 2.6 | x | |||
| Superintendents | 2.0 | x | |||
| Executives | 1.9 | x |
Note: An "x" indicates two groups are significantly different from each other.
Summary of key findings pertaining to Perini are highlighted below
Workers overall reported less positive Perini safety climate, compared to foremen, superintendents, and executives.
- Workers overall reported less positive evaluation of Perini safety program and toolbox talks, as well as experienced more situational constraints caused by other trades, compared to foremen and superintendents. It should be noted that the mean differences between workers and executives are noticeable, although they are not significantly different due to statistical anomaly (e.g., a small sample size of executives, and/or wide standard deviations for either or both groups).
- In contrast to either superintendents or executives, both workers and foremen reported less fatigue (i.e., Fatigue is an issue for my workers – they have made mistakes on the job because they were tired). This result suggests that superintendents and executives may have attributed the causes of mistakes at work differently from workers and foremen.
- Workers overall reported less positive safety practices than foremen. It should be noted that the mean difference between workers and superintendent is noticeable, although it is not significantly different due to statistical anomaly.
- Compared to superintendents, both workers and foremen reported less positive safety priority. Again, the mean differences with executives are noticeable, although they are not significantly different due to statistical anomaly.
- Workers overall had stronger beliefs that media coverage was accurate, compared to foremen, superintendents, and executives.
5-2-a2. Mean Comparisons between Workers and Foremen
Two factors were compared between the two organizational levels: workers and foremen. These factors were (1) importance of scheduling, and (2) concern for others. Significant mean differences are shown in Figures 34a and 34b.
Figure 34a. Importance of Scheduling
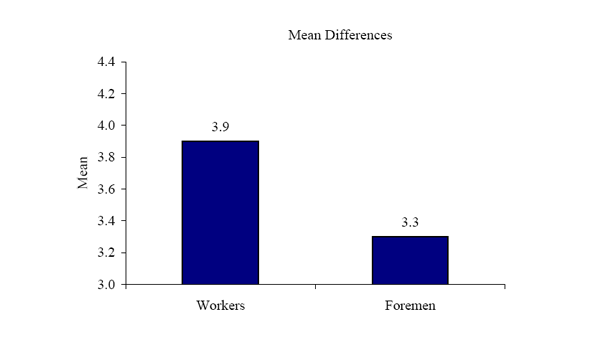
Figure 34b. Concern for Others
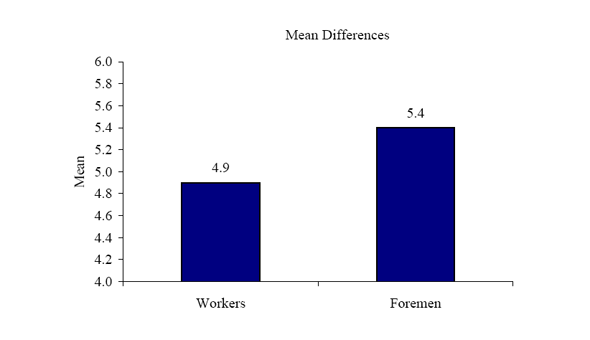
In contrast to foremen, workers expressed stronger beliefs that scheduling was important to Perini. Foremen reported significantly more concern for others' safety than workers.
5-2-a3. Mean comparisons between foremen and superintendents
One factor, employer safety management, was compared between the two organizational levels: foremen and superintendents. No significant mean differences were found.
5-2-a4. Mean comparisons between superintendents and executives
One factor, MGM safety climate, was compared between the two organizational levels: superintendents and executives. No significant mean differences were found.
5-2-a5. Mean comparisons between workers and foremen at two job sites
Previous findings from sections 1-2-b3 and 2-2-b1 suggested the need to examine if foremen and workers at the two job sites differ in their perceptions or experiences about safety. Thus, we investigated how Perini safety climate was perceived by foremen and workers at the two job sites. The significant results show that (1) foremen generally reported more positive Perini safety climate than workers did, and (2) foremen in City Center reported disproportionally more positive Perini safety climate than foremen in Cosmopolitan (21.3 vs. 19.6), in comparison to workers at both job sites (17.1 vs. 17.2). 5-3. Predictors of Safety Performance To understand what factors would predict workers' safety performance, we tested several prediction models by multiple regression analyses based on three sets of data (i.e., the worker survey, the foreman survey, and the combination of superintendent and executive surveys). These empirically verified factors provide directions of future improvement.
5-3-a. Prediction Models Based on the Worker Survey
Three prediction models were examined to identify the most important predictors of safety performance as indicated by workers' safety behaviors, concern for others' safety, and their perceptions of injury risk.
- According to the first prediction model, the following factors were identified as most important in predicting an increase in workers' safety behaviors.
- Positive foremen safety management (e.g., my foreman thinks that safety is more important than productivity).
- Positive Perini safety program (e.g., Perini's safety program works well together with other subcontractor safety programs).
- Positive perception of safety practices such as having enough personal protective equipment, as well as receiving information and training about safety.
- Emphasis on safety as the priority.
- Less fatigue.
- Less time pressure.
- Positive evaluation about toolbox talks.
- Desire to have safety committee for the project.
- According to the second prediction model, the following factors were identified as most important in predicting an increase in workers' concern for others' safety.
- Positive Perini's safety climate.
- Positive foremen safety management.
- Positive perception of safety practices.
- Positive subcontractor safety programs (e.g., subcontractor's safety program works well together with other subcontractor's safety programs).
- Emphasis on safety as the priority.
- Less fatigue.
- Positive evaluation of toolbox talks.
- Desire to have safety committee for the project.
- According to the third prediction model, the following factors were identified as most important in predicting a decrease in workers' perception of injury risk.
- Positive Perini's safety climate.
- Positive perception of safety practices.
- Positive subcontractor safety programs.
- Emphasis on safety as the priority.
- Positive evaluation of toolbox talks.
- Reduction of situational constraints caused by other trades.
5-3-b. Prediction Model Based on the Foreman Survey
One prediction model was examined to identify the most important predictors of safety performance as indicated by workers' safety behaviors. According to the model, the following factors were identified as most important in predicting an increase in workers' safety behaviors.
- Positive Perini safety climate.
- Positive perception of safety practices.
5-3-c. Prediction Model Based on the Superintendent and Executive Surveys
Because of the small sample size for both surveys, the current prediction model was conducted after combining two samples: superintendents and executives. Similarly, the goal of this analysis is to identify the most important predictors of safety performance as indicated by workers' safety behaviors. According to the model, the following factors were identified as most important in predicting an increase in workers' safety behaviors.
- Positive subcontractors' safety program.
- Positive perception of safety practices.
- Positive evaluation of toolbox talks.