Summary Statement
This was a presentation in the Johns Hopkins Bloomberg School of Public Health's Anna Baetjer Course on Occupational Health. It was provided by Bruce Lippy, Ph.D., CIH, CSP
Director of Safety Research, CPWR on 5/5/12
November 4, 2012

Occupational Health: The Anna Baetjer Course
Bruce Lippy, Ph.D., CIH, CSP
Director of Safety Research, CPWR
5/5/12
Table of Contents
- Fatality and injury data for the construction industry
- Major hazards on construction sites
- Managing and controlling construction exposures
- Safety of green construction
- Construction workers during disaster responses
Topic One
Fatality and injury data for the construction industry

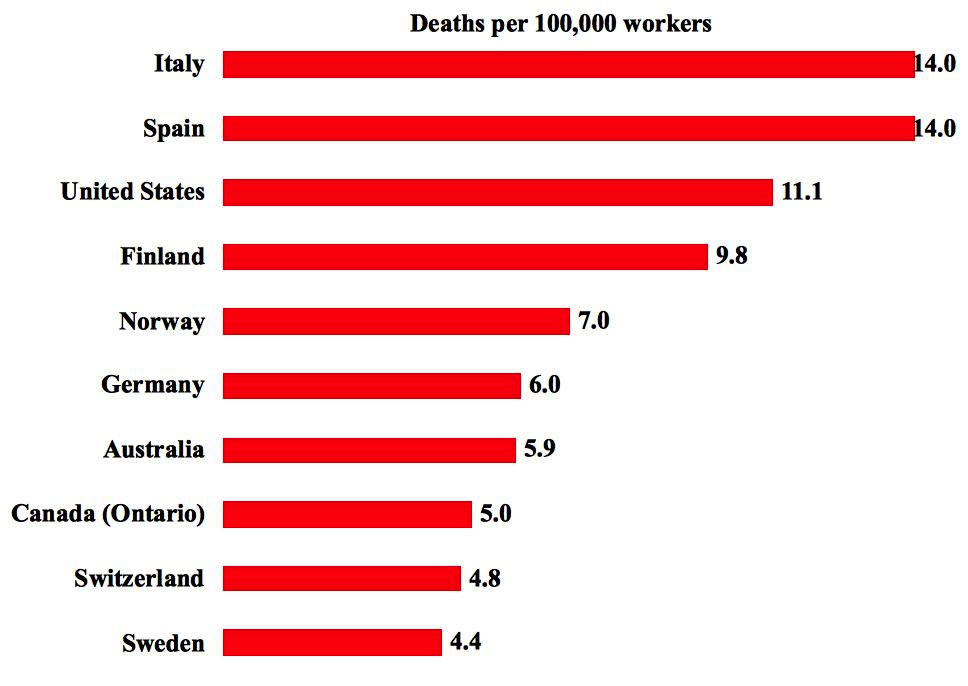
Rate of deaths from injuries in construction, selected countries, 2005
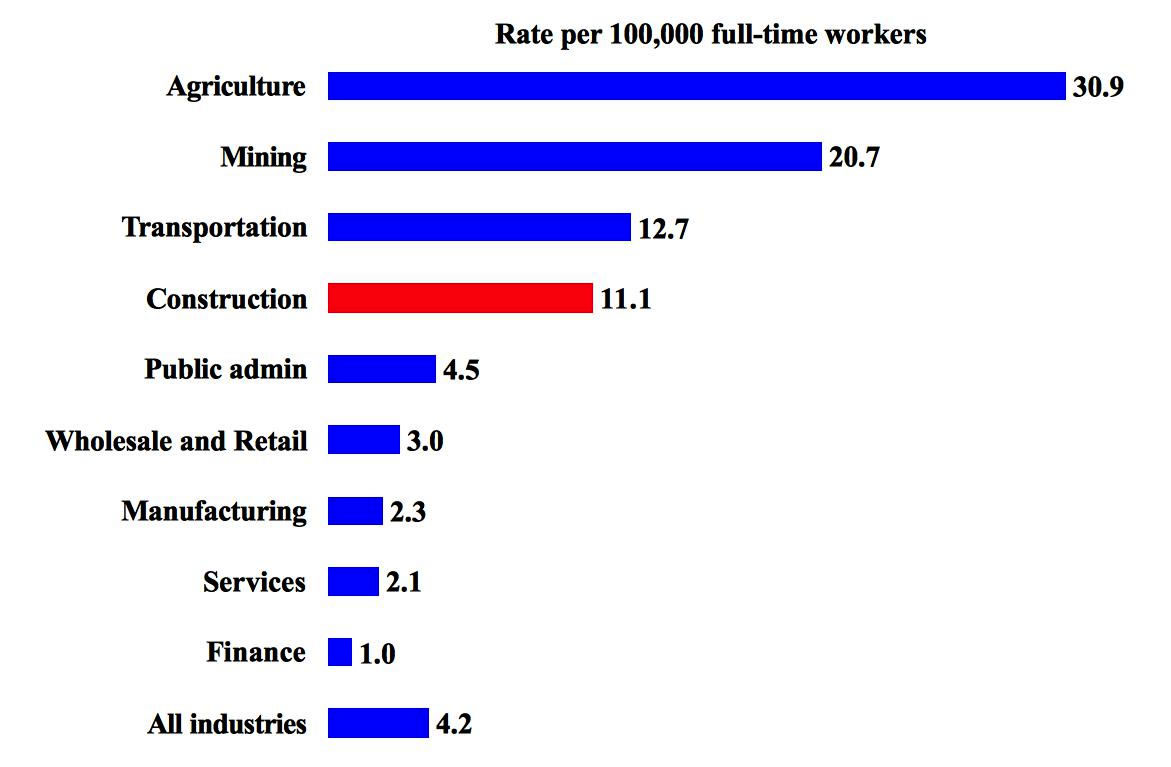
Rate of work-related deaths from injuries, by major industry, 2005 (All employment)
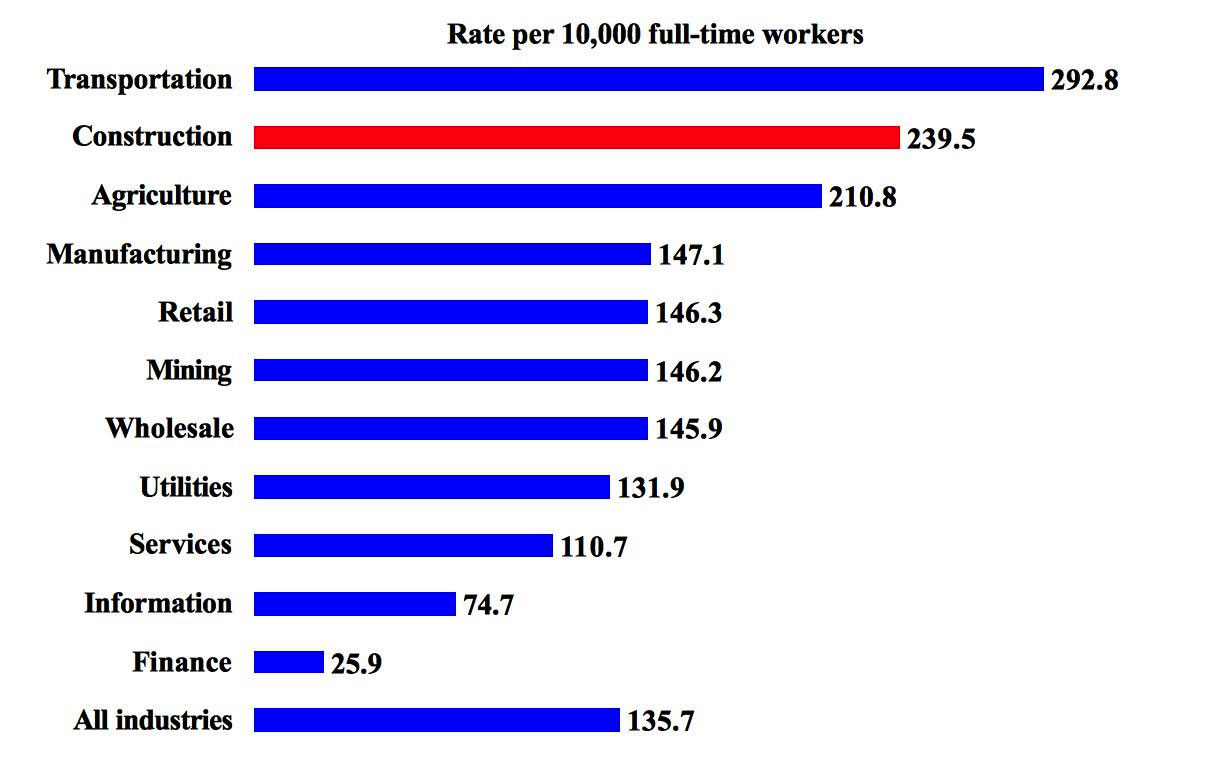
Rate of nonfatal injuries and illnesses with days away from work, by major industry, 2005 (Private wage-and-salary workers)
Rate of work-related deaths from injuries, selected industries, 1992-2005 (All employment)
Why does agriculture lead?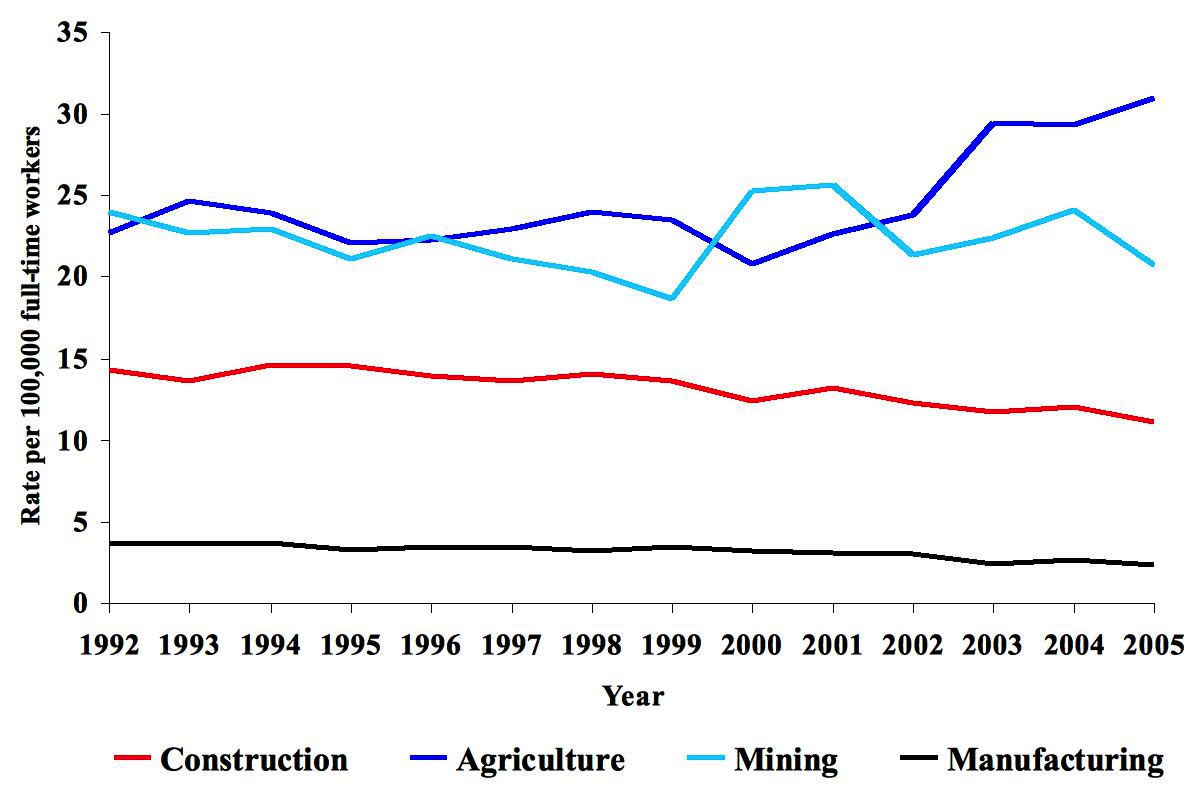
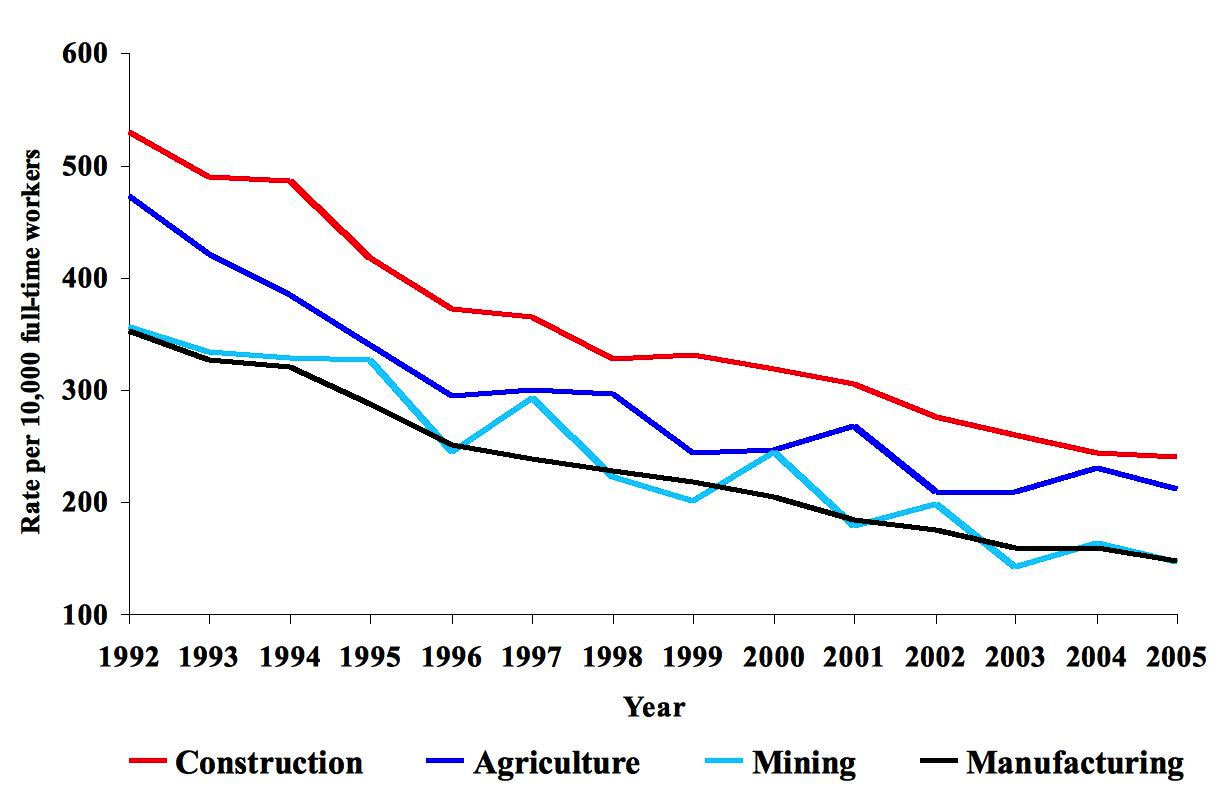
Rate of nonfatal injuries and illnesses with days away from work , selected industries, 1992-2005 (Private wage-and-salary workers)
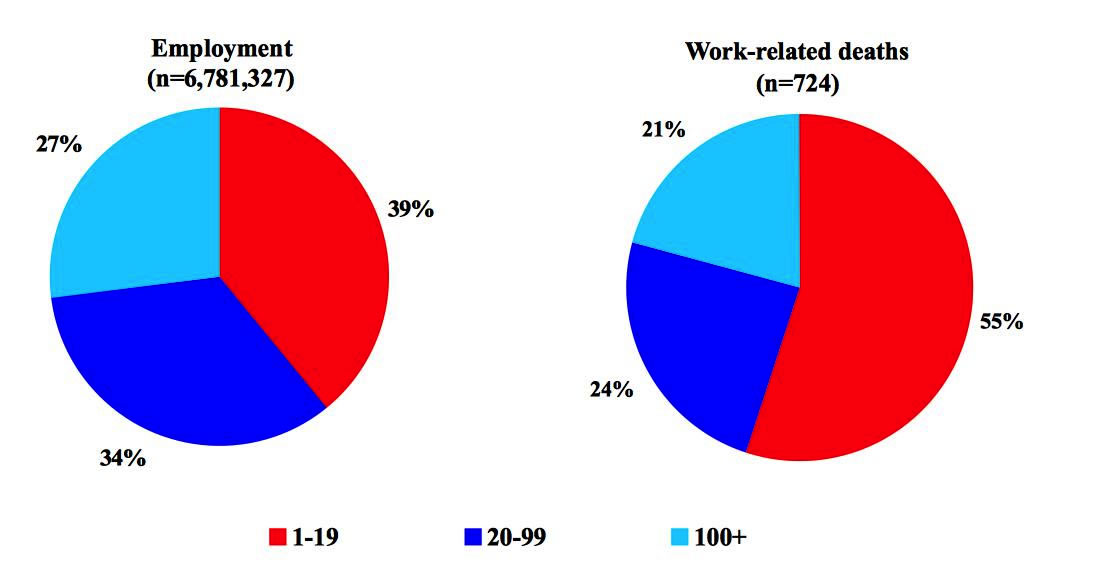
Distribution of construction employment and work-related deaths from injuries, by establishment size, 2005
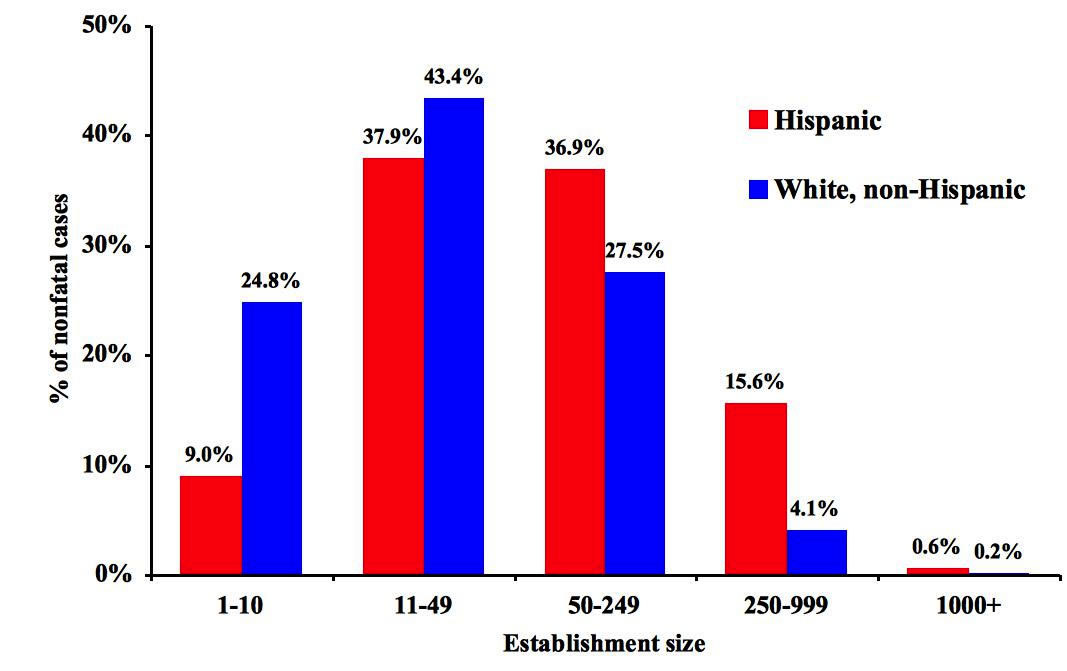
Percentage of injuries and illnesses resulting in days away from work, by ethnicity and establishment size, 2005
Latino crew at the leading edge


Photos courtesy of Robert Carr
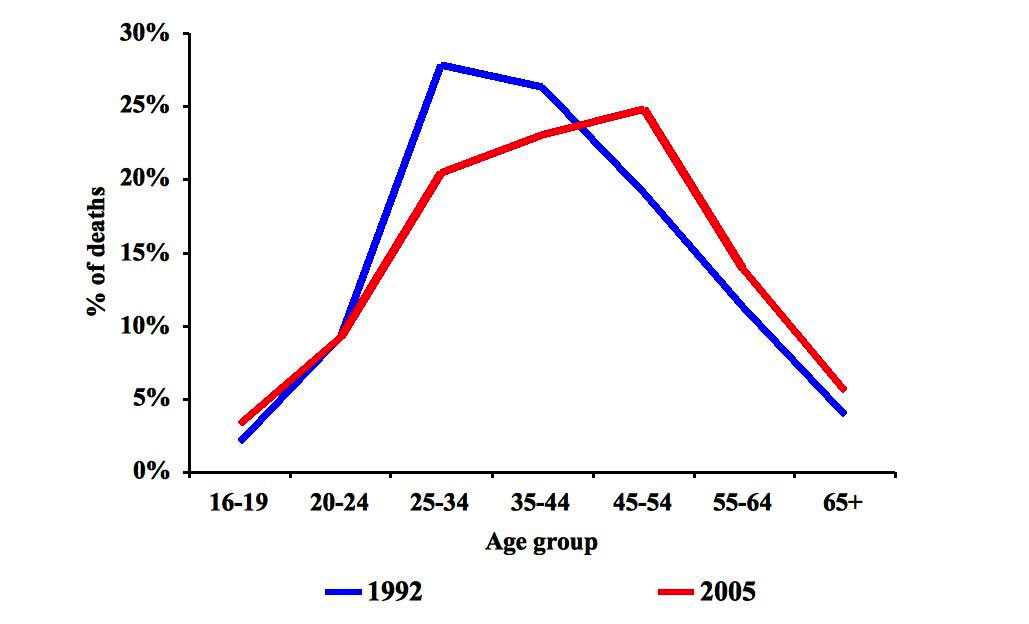
Distribution of deaths from injuries in construction, by age group, 1992 versus 2005
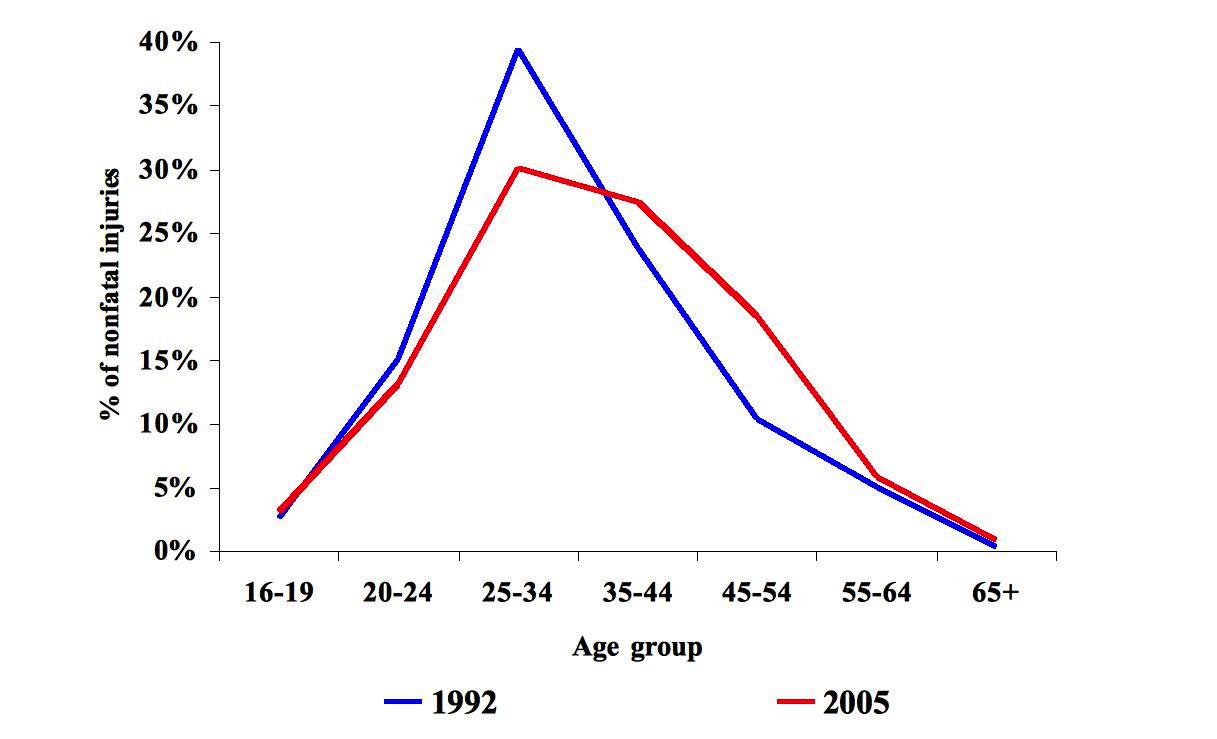
Distribution of nonfatal injuries and illnesses resulting in days away from work in construction, by age group, 1992 versus 2005
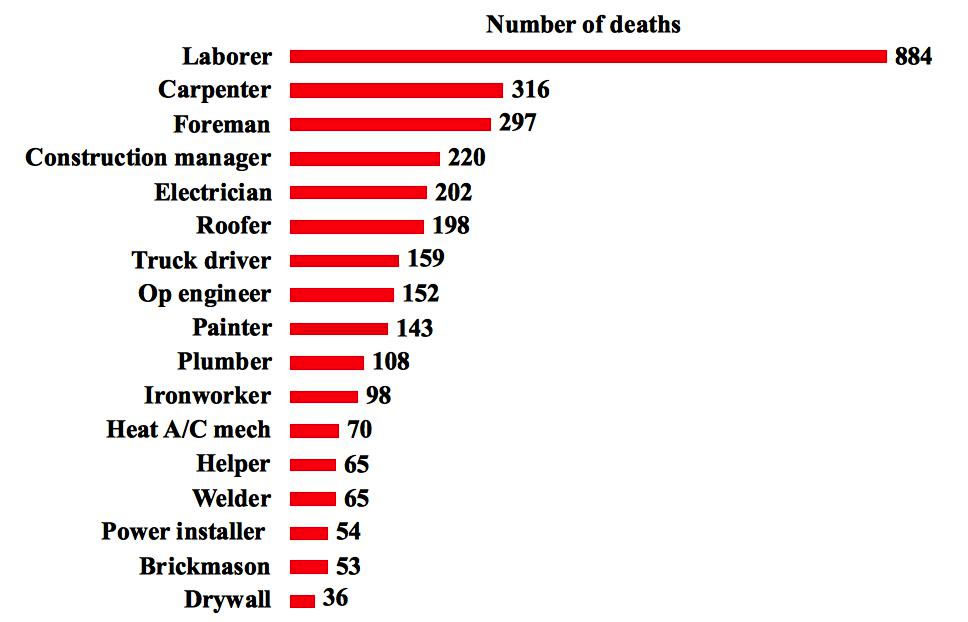
Rate of work-related deaths from injuries, selected construction occupations, 2003-2005 average
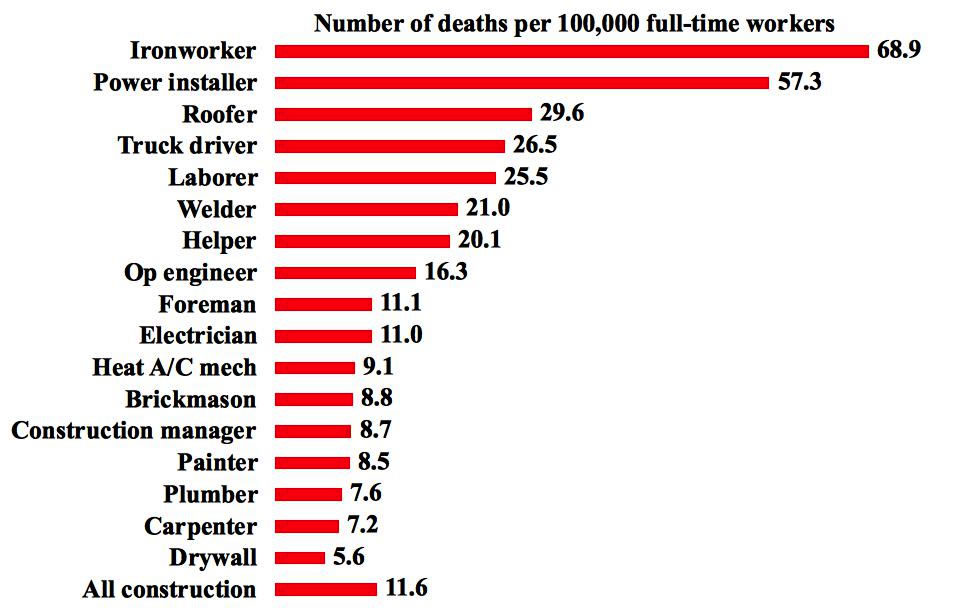
Number of work-related deaths from injuries, selected construction occupations, 2003-2005